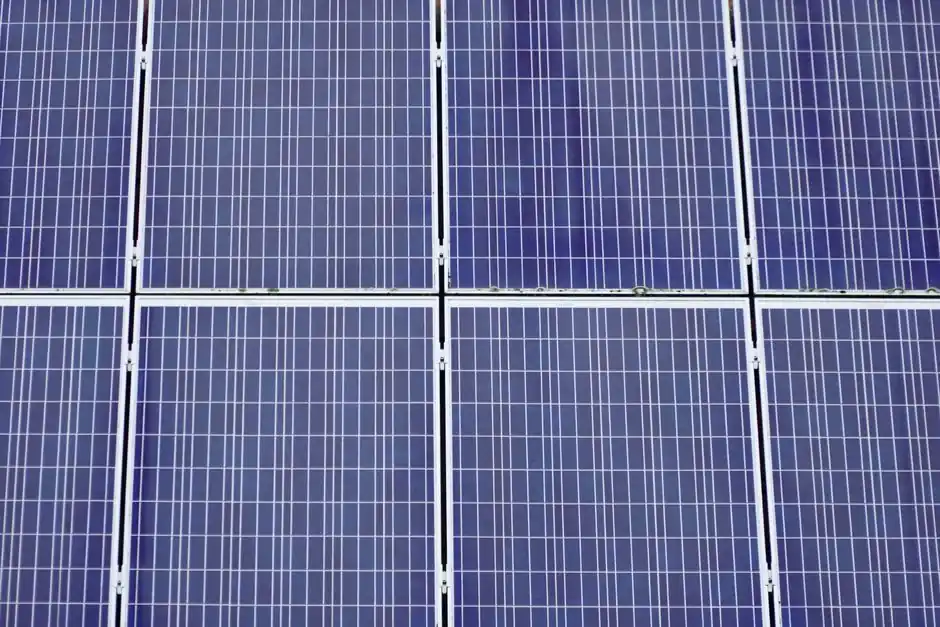
TOPCon accounted for nearly 85% of global cell production at the start of 2026, while legacy mono PERC fell below 5%, according to market analysts CRU [S5]. CPIA and Exawatt place the 2025 TOPCon share higher, at approximately 87%, whereas ITRPV's lower-bound estimate sits at 67% [S2].
The technology reshaped global PV manufacturing between 2020 and 2025: roughly 500 GW of PERC capacity was replaced and then expanded by approximately 1 TW of TOPCon lines, most concentrated in China [S5]. India captured an estimated 60% share of the country's commercial cell output by 2025 per VDMA data, and CEEW identifies TOPCon as the leading commercially available architecture there since 2023 [S4].
2025–2026 Share Estimates Across Three Trackers
CPIA and Exawatt converge on ~87% TOPCon market share for 2025, while ITRPV's lower estimate of 67% reflects its stricter technology-classification methodology [S2].
CRU's separate March 2026 reading of ~85% aligns more closely with the CPIA/Exawatt camp and explicitly tracks production capacity rather than shipment-weighted share [S5]. The India-specific VDMA-cited figure of "nearly 60%" sits below the global average, reflecting a market still digesting legacy PERC lines and ramping n-type capacity more slowly [S4]. For broader solar-cell market context, see the Solar PV Glass 2026 capacity map.
Comparison: TOPCon vs BC vs HJT vs Tandem Through 2035
Four cell architectures now compete for the post-2027 pipeline. BC technology is the most dynamic challenger: Exawatt projects xBC reaching 38% share by 2030, CPIA sees 23% by 2030 rising to 35% by 2035, and ITRPV forecasts 33% by 2035 [S2]. TOPCon's efficiency ceiling of 0.5–1.5 percentage points above PERC at mass-production level is precisely what makes BC's bifacial gain attractive for premium modules [S8].
HJT remains a niche play, with 2025 share estimates ranging from 2.6% (CPIA) to 8% (ITRPV) and projected to plateau between 10% and 14% by 2035 depending on the tracker [S2]. Tandem (perovskite-silicon) architectures are not commercially material before 2030: Exawatt marks tandem entry at 0.5% in 2026, while ITRPV's most optimistic long-term view reaches 12% by 2035 [S2]. One manufacturer reference point for n-type comparison: REC Group's Alpha Pure-R series uses HJT cells at efficiencies up to 22.3% with lead-free construction, a different architecture from TOPCon but useful for benchmarking premium n-type pricing [S1].
Manufacturer Landscape: Capacity, Not Just Share
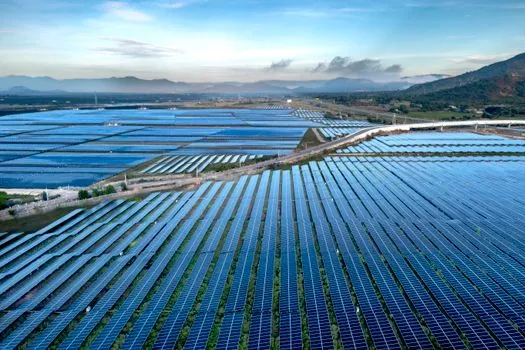
China retains roughly 1 TW of installed TOPCon cell capacity, built in a synchronized 2022–2025 expansion that pulled upstream equipment and consumables suppliers along at the same pace [S5]. Outside China, India hosts the most active new-build pipeline: the top five Indian TOPCon panel manufacturers identified in July 2026 industry coverage are Novergy Solar, Waaree Energies, Vikram Solar, Adani Solar, and Premier Energies [S7].
The U.S. and Türkiye are also adding cell capacity, though at smaller scale, supported by local-content incentives and the policy goal of onshoring solar supply chains noted in BloombergNEF's Energy Transition Investment Trends report [S5]. CEEW's May 2026 study highlights that Indian cell production costs remain higher than global benchmarks due to capital expenditure, consumables, and an underdeveloped equipment supply chain, even though module-assembly capacity has scaled rapidly [S4].
Process Stack and Cost Drivers
Chinese TOPCon fabs primarily use low-pressure chemical vapor deposition (LPCVD) or plasma-enhanced CVD (PECVD) to deposit the rear-side tunnel oxide (TO) layer, typically 1.5–2.0 nm thick, and the phosphorus-doped amorphous silicon layer, usually 50–100 nm [S5]. Phosphine (PH₃) gas handling drives a large share of fab capex for new entrants because of its toxicity, pyrophoricity, and the need for gas bunkers, continuous air monitoring, and dedicated PPE infrastructure [S5].
Silane (SiH₄) is widely used for the a-Si deposition step and carries similar handling complexity [S5]. These gas-handling costs are a key reason why greenfield TOPCon fabs outside China face materially higher capex per gigawatt than Chinese benchmark projects, even when the underlying deposition toolset is identical [S5]. The manufacturing cost differential is also why Indian cell production economics remain challenging, per CEEW's May 2026 supply-chain analysis [S4].
Reliability and Module-Level Failure Modes
Two 2025 research findings affect TOPCon bankability in field deployments. Oxford and Changzhou university researchers identified a Laser-Enhanced Contact Optimization (LECO) failure mode in which reverse-bias cycling causes a massive increase in series resistance, potentially forcing manufacturers to halt LECO adoption or redesign the contact stack [S1]. Separately, a University of New South Wales (UNSW) study showed that EVA-encapsulated TOPCon modules in damp-heat conditions accelerate acetic acid formation, corroding metallization and reducing fill factor, a particular concern for tropical and monsoon-climate projects [S1].
The UNSW finding is already pushing some manufacturers toward polyolefin elastomer (POE) encapsulants and alternative metallization stacks, both of which raise bill-of-materials cost [S1]. For procurement teams evaluating TOPCon versus HJT and BC, the encapsulant and contact-redesign choices should be tracked alongside cell-level efficiency when scoring supplier proposals.
Market Sizing, Segments, and Regional Split
Coherent Market Insights sizes the global TOPCon cell market at USD 13.66 billion in 2026, expanding at 11.8% CAGR to USD 29.83 billion by 2033, with n-type cells at 54.6% of that market, rooftop installations at 52.9%, and residential at 46.6% [S1]. The broader solar cell market (all technologies) is larger: Mordor Intelligence places it at USD 177.07 billion in 2026, reaching USD 310.39 billion by 2031 at 11.88% CAGR, with crystalline silicon controlling 84.6% of 2025 volume [S3].
Asia-Pacific leads TOPCon demand at 37.8% of 2026 share per Coherent Market Insights, while North America at 19.5% is the fastest-growing region [S1]. Mordor Intelligence puts the broader Asia-Pacific solar cell share at 64.3% of 2025 revenue, with the Middle East and Africa delivering the highest regional CAGR at 23.2% [S3].
Selection Criteria for TOPCon Sourcing Decisions
Four decision criteria stand out for procurement teams evaluating TOPCon suppliers. First, share and capacity: prioritize manufacturers on the top-five lists in target regions (e.g., the Indian panel tier: Novergy, Waaree, Vikram, Adani, Premier) and confirm gigawatt-scale cell fab ownership, not just module assembly [S7]. Second, encapsulant and contact process: require disclosure of EVA-versus-POE film selection and LECO-versus-non-LECO contact formation, given the documented field failure modes [S1].
Third, efficiency bin and warranty: TOPCon production lines typically deliver 0.5–1.5 percentage points more efficiency than PERC at mass-production level, but the actual bin a supplier offers varies, and that drives specific yield per Watt-peak installed [S8]. Fourth, gas-handling compliance and capex origin: greenfield fabs outside China face higher capex because of phosphine and silane infrastructure, which can affect delivery schedule and module price-lock terms [S5]. Downstream inverter pairing also matters, see the 2026 solar inverter vendor stack for matching high-efficiency modules to grid-forming inverter specs.
Trackable signals for the next six months: (1) CPIA's mid-2026 update on whether 2025 TOPCon share is revised above or below 87%, (2) any first commercial shipment volumes of xBC modules from Chinese tier-1 suppliers targeting the 23–38% 2030 share band, and (3) the ITRPV 2026 revision cadence, given its lower 67% 2025 baseline implies a steeper decline curve than the other two trackers.
The underlying component specifications are covered under load cell, load cell module, and pressure transmitter.