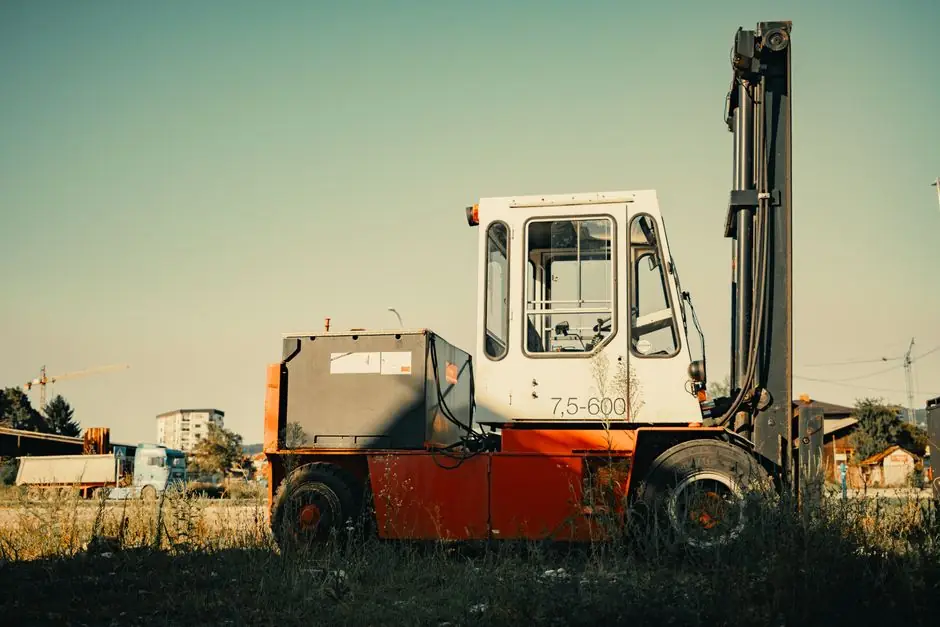
For a typical 25 to 50 tonne truck-mounted crane operating 1,500 to 2,500 hours per year, purchase price is only one of five major cost lines; published lifecycle models show fuel, maintenance, financing, and residual value collectively equal or exceed acquisition cost over a seven-year hold [S5][S9].
Heavy-equipment TCO frameworks from fleet-leasing analysts, OEM lifetime-value calculators, and policy-grade tools such as the ICCT TCO Calculator all converge on the same structural breakdown: capital, energy, maintenance, financing or insurance, and residual value, with downtime cost layered on top as a separate risk line [S3][S4][S7][S8]. Operators comparing tenders at the quote stage routinely underweight the operating and end-of-life lines, which is why two cranes with similar invoice prices can diverge by 20 to 35 percent in lifetime cost [S5][S9].
What TCO actually counts: the five-line cost structure
The widely used heavy-vehicle TCO framework enumerates vehicle cost and depreciation, financing, fuel costs, insurance costs, maintenance and repair costs, taxes and fees, and downtime as the core buckets [S1][S2][S3]. Applied to a truck-mounted crane, the same buckets map onto: chassis plus boom package, lift/load financing, diesel or electrified auxiliaries, operator and rigging insurance, scheduled plus unscheduled service, registration and lifting-permit fees, and idle-time losses on the project.
The U.S. Department of Energy and NREL powertrain TCO studies evaluate six powertrain technologies across the same line items, demonstrating that the methodology is portable from on-road trucks to crane chassis once utilization hours replace annual mileage as the duty input [S2]. The ICCT calculator default 5-year analysis period can be extended to 7 or 10 years to match the typical service life of a commercial boom truck, with annual utilization inputs of 10,000 to 200,000 miles scaled into lifting hours [S3].
For project-finance modeling, the meaningful shift is that TCO now treats the crane as a multi-line budget item rather than a one-time procurement event; a low-bid unit can become the most expensive asset once maintenance delays, parts shortages, and weak residual demand are layered in [S5].
Cost driver ranking: which line moves the budget most
Across published heavy-equipment TCO templates, the typical seven-year ownership split for a mid-size boom truck falls into rough bands: acquisition 40 to 60 percent, fuel 15 to 25 percent, maintenance and repair 10 to 18 percent, financing and insurance 5 to 10 percent, taxes and fees 1 to 3 percent, and residual recovery negative 15 to 30 percent [S1][S2][S5][S9].
Fuel volatility has the steepest year-to-year sensitivity because energy prices and route conditions are less predictable; engine efficiency and load planning are therefore the highest-leverage engineering decisions on this line [S5]. Compliance pressure drives a steady upward drift on the maintenance and certification lines as lifting, emissions, and operator-licensing standards tighten on public-works and urban sites [S5]. Demand for uptime on tighter project schedules turns downtime from a nuisance into a top-three cost line, and the ratchet is asymmetric: a single multi-day boom-out event can erase a year of fuel savings.
Fleet-leasing guidance from Verizon Connect and Ryder reiterates that operators who omit financing, insurance, and residual value from the analysis routinely understate true cost by 15 to 25 percent, especially when lease-versus-own decisions are on the table [S7][S8].
Comparison matrix: matching crane type to cost profile
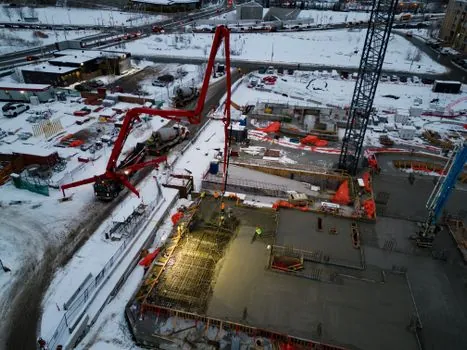
Three common spec bands map to distinctly different TCO shapes. A light-duty 8 to 16 tonne boom truck on a 4x2 chassis carries low acquisition cost and high utilization flexibility, but suffers elevated fuel cost per lifted ton and weaker residual value outside regional construction markets. [S5]
A mid-range 25 to 50 tonne unit on a 6x4 chassis typically hits the lowest TCO per operating hour because fuel efficiency, parts commonality, and resale demand all converge; this is the segment where 7-year lifecycle models show the tightest cost spread between vendors [S5]. A heavy 70 to 130 tonne all-terrain or rough-terrain crane truck carries high acquisition cost, but the cost-per-lifted-ton falls sharply on infrastructure and energy projects where daily output is high; downside is that downtime risk is amplified because specialist labor and parts inventories are scarcer.
Decision criteria that actually move the numbers are: annual lifting hours (under 1,000 favors lighter units, over 2,500 favors heavier), average lift radius (under 18 m favors knuckle-boom, over 25 m favors telescopic), duty environment (urban with emissions restrictions favors hybrid or Stage V/V), and resale market depth (North America and Western Europe favor nameplate heavy units, while emerging markets tolerate Chinese and Korean chassis at lower acquisition cost) [S5][S9].
Total cost of ownership math: a worked 7-year example
Setting up a representative case: a 30 tonne telescopic boom truck, 1,800 operating hours per year, diesel Stage V, financed over 5 years at 6.5 percent, US$120,000 acquisition. Capital cost line is US$120,000; financing cost at 6.5 percent over 60 months adds roughly US$20,000 in interest, taking the capital line to US$140,000 [S7][S8].
Fuel at 18 to 22 L/hr diesel and 1,800 hours per year gives 32,400 to 39,600 L/yr; over seven years at a blended US$1.10 to 1.30/L, the fuel line lands in the US$250,000 to 360,000 range, the single largest cost bucket [S1][S5]. Maintenance and repair, scheduled plus unscheduled, is commonly modeled at 1.5 to 3.0 percent of acquisition per service year, giving US$13,000 to 32,000 annually and US$90,000 to 225,000 over the period; tires, hydraulic hoses, and outrigger service dominate the variable portion [S2][S9].
Insurance and registration typically run 2 to 4 percent of acquisition per year, US$2,400 to 4,800, totaling US$17,000 to 34,000 over the hold [S7]. Residual value at year seven, assuming mid-life condition and a nameplate chassis, recovers 35 to 50 percent of acquisition, a negative cost line of minus US$42,000 to 60,000. The seven-year gross TCO therefore lands in the US$455,000 to 700,000 band before downtime, with downtime risk adding an unmodeled 5 to 20 percent if the unit suffers one major lifting-system event [S5][S8].
Downtime, the cost line that breaks the model
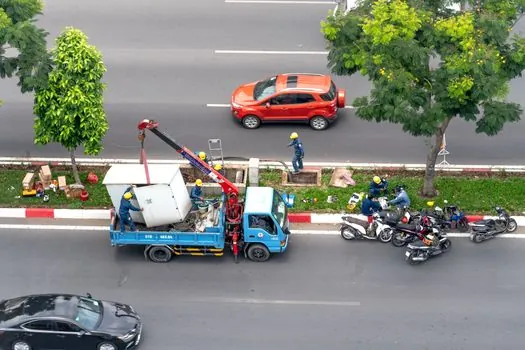
Downtime is the variable that the OEM Lifetime Value Calculator flags as the single most expensive event for any lifting-asset owner, ahead of environmental or safety incidents, because it compounds lost billable hours, mobilization costs for replacement equipment, and contractual penalty exposure [S4]. The same calculator treats safety, productivity, and maintenance as the three TCO pillars and assigns a user-set priority ranking to weight them, mirroring the line items in the heavy-vehicle TCO framework [S1][S4].
For a truck-mounted crane, downtime is driven by four predictable failure modes: hydraulic-system leaks on aging booms, outrigger cylinder failures under uneven site loading, electrical and control faults on LMI systems, and chassis driveline events on units that double as transport vehicles. Each mode maps to a specific maintenance protocol: 500-hour hydraulic inspection, 1,000-hour outrigger rebuild, annual LMI calibration against the OEM load chart, and chassis service at the truck OEM interval.
Proactive safety management is consistently cheaper than reactive recovery, and safer fleets attract higher-caliber operators, which directly improves utilization and resale value [S4]. For project planning, the engineering rule is to budget downtime exposure at 5 to 10 percent of operating revenue and to size the maintenance reserve accordingly, a figure echoed across fleet-management TCO guides [S7][S8].
Where TCO models break: limits and assumption traps
TCO models are sensitive to utilization rate, residual-value assumption, and financing rate; a 20 percent miss in any one of these lines can swing the seven-year total by 8 to 15 percent [S1][S7]. Most published calculators assume steady-state utilization, but crane work is project-cyclical, and idle months do not stop depreciation or insurance accrual, which compresses the effective TCO per productive hour [S5].
Compliance and certification costs are often understated in the first three years of a TCO model because they tend to spike at the 5-year recertification point and at major regulatory step-ups such as Stage VI transition or revised ASME B30.5 hoisting rules. Operators running mixed fleets that include dump truck and aerial work truck assets also need to harmonize downtime reserves, since parts inventory and operator training are not freely substitutable across classes [S5][S9].
The ICCT calculator is structured for on-road heavy vehicles, with diesel and battery-electric powertrain comparison as the primary output, so applying it to a crane truck requires substituting lifting hours for mileage and adding crane-specific lines such as LMI calibration, boom inspection, and rigging consumables [S3]. Off-road equipment electrification is moving through a separate cost curve, and total-cost parity with diesel for crane carriers is not yet a settled assumption for duty cycles above 1,500 hours per year.
Spec selection links: which TCO lever to pull first
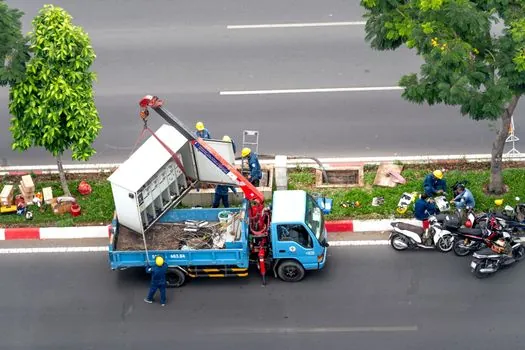
For buyers mapping spec to ownership cost, the highest-leverage decisions are, in order: matching boom capacity to actual lift radius rather than peak catalog rating, choosing a chassis with documented parts commonality in the operating region, specifying an emissions tier that meets the project site without overpaying for a tier the duty cycle does not require, and locking a residual-value floor with the OEM or financier at the procurement stage [S5][S9]. Cross-referencing the truck-mounted crane reference against related selection guides, particularly the truck crane versus tower crane spec map, helps separate cases where mobile flexibility is a TCO asset from cases where a fixed installation is cheaper over the project horizon.
For mixed-fleet owners, the same TCO logic applied to a truck scale or reach truck shows that utilization, residual depth, and downtime protocol dominate purchase price, and a fleet-wide TCO rollup prevents procurement from optimizing one line at the expense of the others. Operators preparing a tender response in Q3 2026 should treat the 7-year cost stack above as a baseline, request OEM residual-value commitments in writing, and require a maintenance reserve line of at least 5 percent of acquisition per year to keep the modeled TCO from drifting past the bid price.