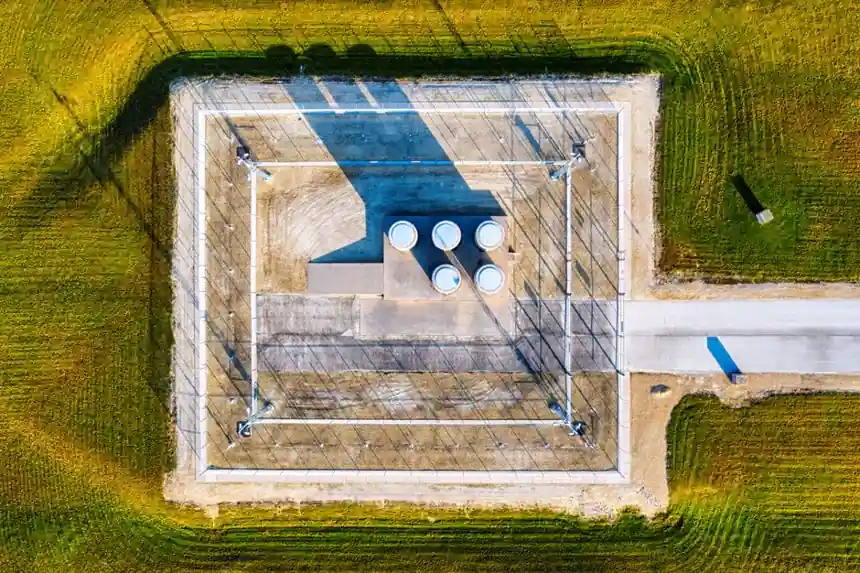
U.S. battery energy storage installations reached 20.2 GWh in Q2 2026, the largest single quarter on record, and brought first-half 2026 deployment to 30.8 GWh, up 23% year over year, per the U.S. Energy Storage Market Outlook Q3 2026 from SEIA and Benchmark Mineral Intelligence [S3][S5].
Utility-scale projects accounted for roughly 18 GWh of the Q2 total, supported by seven GWh-scale projects, four in Arizona, two in California, and one in Utah, while residential storage fell 27% year over year to 657 MWh after the federal 25D credit expired [S5]. Benchmark/SEIA also raised their 2030 U.S. storage forecast by 11.5% to 683 GWh, with 2026 tracking toward 35 GW/70 GWh [S1][S3].
Quarterly and First-Half GWh Trajectory
Q1 2026 set the opening benchmark at 9.7 GWh of new installed capacity, the strongest first quarter on record, before Q2 2026 added 20.2 GWh to lift the half-year total to 30.8 GWh [S2][S5]. The 30.8 GWh H1 figure already exceeds the full-year 2025 U.S. The United States added 52.1 GWh of new energy storage capacity in 2025, according to the report. battery storage capacity came online in Q2 2026 alone [S3][S4][S5].
Benchmark's 2026 outlook, prepared for SEIA, projects 35 GW/70 GWh of total installations for the year, split 20.2 GW/62.4 GWh utility-scale and 14.8 GW/7.3 GWh behind-the-meter, including residential, commercial, and industrial segments [S1]. At the Q2 run rate of 20.2 GWh per quarter, 2026 would print near 60-65 GWh even before seasonal Q3 and Q4 ramps, which is consistent with InfoLink's 49 GWh U.S. figure if the 2026 number is later reconciled against a different scope [S4].
Utility-Scale Mix, State Split, and the Solar-Coupling Ratio
Utility-scale storage now totals 165 GWh in the U.S., up from 88 GWh eighteen months earlier, a 77 GWh swing in operating capacity during the first 18 months of the Trump administration [S3]. Of Q2 utility-scale additions, 44% were paired with solar and 56% were standalone storage, a shift that affects the choice of storage rack and storage cage layouts inside containerized BESS enclosures when DC-side PV inverters and AC-side BESS inverters are co-located [S5].
Arizona posted a single-state record 6.2 GWh in Q2 2026, with Texas adding 3.8 GWh and California 3.6 GWh, and more than 74% of Q2 capacity was installed in states that Donald Trump won in the 2024 presidential election [S5]. Benchmark's Shan Tomouk framed the geographic shift directly: "Energy storage is no longer just a California and Texas story anymore," pointing to pipeline growth in Arizona, Nevada, Oregon, and Colorado [S5].
Behind-the-Meter, Residential Slide, and Data-Center Pull
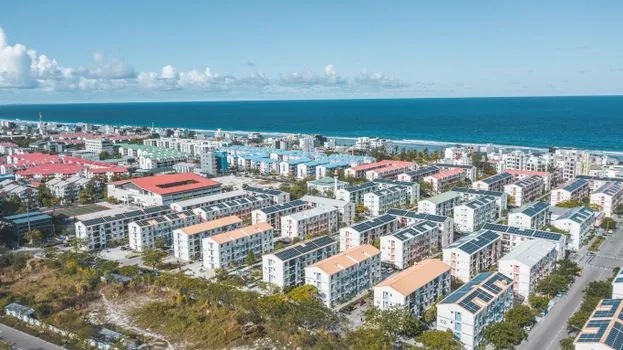
Behind-the-meter storage stood at 12 GW/8 GWh of the U.S. total at end-2025, with the segment holding a 13% share of installations; residential alone grew sharply in 2025 as homeowners pulled installations forward ahead of the Section 25D credit's expiration at year end [S1]. The Q2 2026 print reverses that pull: U.S. homes added only 657 MWh, down 27% year over year, and Benchmark forecasts residential installations falling 16% in 2026 after a 56% jump in 2025 [S5].
Commercial and industrial storage added approximately 1.8 GWh in Q2 2026, and Benchmark expects data centers to be a major future demand source as developers pair batteries with onsite solar, wind, and in some cases natural gas generation to manage fast-changing loads and grid-connection constraints [S5]. InfoLink's 2026 global view reinforces the same signal: 353.4 GWh of new global battery storage is expected in 2026, up from 275.3 GWh deployed in 2025, with AI data center demand cited as the primary accelerator [S4].
Long-Duration, Cell Supply, and LDES Cost Gap
Long-duration energy storage (LDES) accounted for only 6% of global energy storage installations in 2025, as lithium-ion continued to dominate the economically critical 4 to 8 hour segment, per Wood Mackenzie [S4]. Global LDES funding fell 30% in 2025, with venture capital investments down 72%, and Wood Mackenzie's Priya Shrivastava stated that "VRFB project costs are projected to fall by over 30% by 2034 but will still be about 240% higher than lithium iron phosphate battery projects for 4-hour duration" [S4].
Cell and BESS shipments confirm the scale: 612.39 GWh of energy storage cells shipped globally in 2025, nearly double the prior year, with 801 GWh forecast for 2026, and BESS shipments rose 75.5% to 421.2 GWh in 2025 with 600 GWh projected for 2026 [S4]. For project engineers evaluating BESS safety envelopes, the BESS fire suppression spec map covering NFPA 855 and UL 9540A remains the binding reference and is detailed in BESS fire suppression 2026: market size, agent choice, NFPA 855 and UL 9540A spec map [S4].
Global Comparison: U.S., Europe, China, and Australia
China led 2025 battery storage additions at 167 GWh, with another 203.5 GWh projected for 2026, versus 52.1 GWh added in the U.S. in 2025 and 49 GWh forecast for 2026 by InfoLink, a tighter U.S. number than the 70 GWh Benchmark/SEIA view because InfoLink tracks commissioned BESS rather than the broader storage installation scope [S4]. Europe installed 25.3 GWh in 2025 with 35.1 GWh expected in 2026, Australia added 11.4 GWh in 2025 and is projected to add 12.9 GWh in 2026, and the Middle East moved from 8 GWh in 2025 to a forecast 20.1 GWh in 2026, with Chile and Japan also adding [S4].
At the global level, the IEA reports 108 GW of new battery storage capacity was deployed worldwide in 2025, 40% more than in 2024, and installed capacity is now eleven times higher than in 2021 [S6]. That 108 GW figure is power-rated, not energy-rated, and converts to a higher GWh number when weighted by typical 4 hour duration, which is consistent with InfoLink's 275.3 GWh 2025 global energy addition [S4][S6].
Selection and Sourcing Signals for Spec Engineers
For project teams sizing enclosures, inverters, and racking, three numbers are directly actionable from the Q2 2026 data: the 165 GWh U.S. utility-scale operating base, the 30.8 GWh H1 run rate, and the 683 GWh 2030 forecast ceiling, each of which sets different bounds on supply commitments [S3]. The 44% solar-paired / 56% standalone split is also a procurement signal, because hybrid PV-plus-storage sites typically need different DC combiner layouts, more flow meter instrumentation on liquid cooling loops, and revised pressure transmitter tap locations compared to standalone BESS [S5].
Two policy and supply risks are now trackable. First, the residential 25D credit expiration is already showing up in the data, with Q2 residential down 27% year over year and a 16% 2026 decline forecast, so behind-the-meter volume assumptions need to be re-cut [S1][S5]. Second, global cell supply is the bottleneck: 612.39 GWh shipped in 2025 versus 801 GWh forecast for 2026 means a 31% volume jump, and any LFP or NMC cell allocation slip will propagate into BESS delivery dates through 2027 [S4]. Related unit-economics context for downstream pack pricing sits in EV battery pack price per kWh in 2025-2026: the segment, chemistry and region spread.