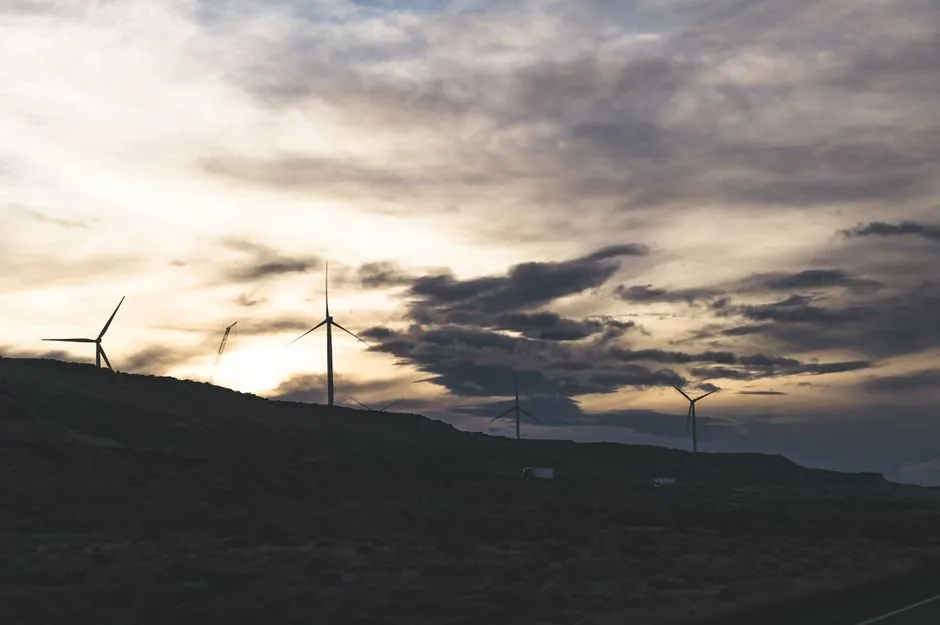
Onshore hub heights reached an average 103.4 m in 2023, up 83% since 1998–1999, while offshore hubs are projected to grow from 100 m (2016) to roughly 150 m by 2035 [S1]. Larger rotors are non-negotiable: 98% of newly installed U.S. turbines in 2023 used rotors of 115 m diameter or larger, and the average newly installed U.S. turbine hit 3.4 MW, up 5% year-on-year and 375% since 1998–1999 [S1].
The global blade market was valued at $27.12 B in 2024 and is forecast to reach $210.99 B by 2035 at a 20.5% CAGR, segmented by material (glass fiber vs carbon fiber), blade length (≤27 m, 28–37 m, 38–50 m, >50 m), and capacity (<2 MW, 2–5 MW, >5 MW) [S4]. TPI Composites and Siemens Gamesa have announced new blade plants in India and Turkey to serve Asia-Pacific and European demand [S4]. The structural shift that any 2026 capacity plan must price in: offshore turbines are now specified up to 26 MW with 153 m blades, and onshore up to 15 MW with 131 m blades [S7].
Driver #1: Blade Length, Rotor Swept Area, and Capacity Class
Capacity planning starts from the blade, because the blade is the bottleneck on every other station in the plant. Rotor swept areas have grown roughly 670% since 1998–1999, and each 1 m of extra blade length raises the energy capture envelope of a given site because available wind power scales with the cube of wind speed [S1][S3].
For capacity planners, the actionable data point is the size mix. SANY Renewable Energy's published blade line covers blades for the 3.X MW class with a 3,600+ unit annual production capacity at single-site scale, illustrating what a single dedicated facility can absorb at the most common onshore class [S8]. A 2026 process-engineering study on an onshore blade plant (Springer, 2026) treats cycle time, defect rate, and resin/void control as the primary levers, since blade layup uses RTM, VARI, and hand layup composites where voids directly scrap the part [S5]. The implication: a 50 m blade line is not a scaled 30 m blade line. Mold footprint, infusion bed length, and post-cure oven size all step-change.
For an end-to-end view of the equipment train behind that capacity, see the wind turbine blade manufacturing equipment spec map.
Driver #2: Transport, Logistics, and the Practical Blade-Length Ceiling
Blade transport is the single hardest physical constraint on how fast the line can grow. A single blade move can require close to a year of planning and up to ten truck loads, with route geometry limited by curves, bridge clearances, and overpass heights that the blade cannot fold or bend under [S1][S6]. As a result, planners increasingly co-locate new blade factories near port or rail spurs, and inland plants cap blade length at what can clear the local road network.
The supply-chain consequence is a two-tier plant geography: coastal mega-factories (>50 m blades for offshore, serving 15–26 MW turbines) and inland regional plants (≤37 m blades for 2–5 MW onshore) [S4][S7]. The DOE is also funding slender, flexible blade research to relax the road-geometry constraint, but those designs are not yet at commercial scale [S1]. End-of-life adds a second planning horizon: most blades are designed for a 20 year service life, after which they are typically decommissioned, so any new capacity must clear regulatory and recycling paths before commissioning, not after [S2].
Driver #3: Cycle Time, Defect Rate, and Composite Process Selection
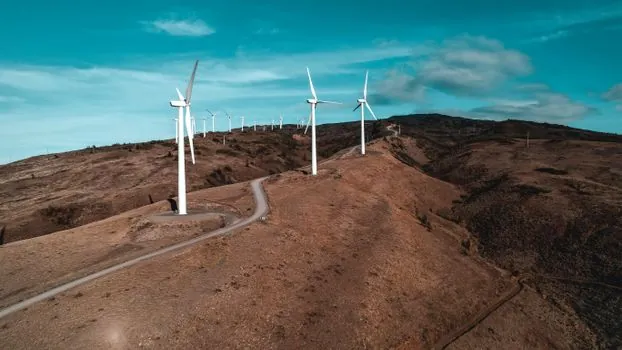
Capacity is a function of cycle time and first-pass yield, not just mold count. The 2026 Springer study (Silva, 2026) frames blade production as a process-engineering problem with three decision gates: resin distribution uniformity, void content, and cutting/trimming waste [S5]. Hand layup is the lowest-capex route but the highest-waste and highest-variability; VARI and RTM cut waste and improve repeatability at the cost of longer cure cycles and tighter process control [S5].
The comparison that planners actually run on a spreadsheet looks like this:
Hand layup: low CapEx, high labor content, 8–15% scrap on void/defect, best for short blades and prototype runs. Vacuum-assisted resin infusion (VARI): mid CapEx, lower void content, longer infusion/cure cycle, dominant for 38–50 m onshore blades. Resin transfer molding (RTM): highest CapEx and tool cost, tightest tolerance, lowest scrap rate, used for >50 m offshore blades where rework is unaffordable [S5][S9]. Net: doubling blade length does not double cycle time; it roughly triples the required capex per unit of annual output, because infusion area scales with surface, not volume. This is the core reason a 3,600-unit annual line for 3.X MW onshore blades is realistic at single-site scale, but a 26 MW offshore blade line typically requires phased multi-line investment [S8].
Driver #4: Siting, Power, and Where New Capacity Is Actually Going
Capacity additions are not happening evenly. MRFR's 2026 update names North America as the largest current market and Asia-Pacific as the fastest-growing region, with named capacity expansion by TPI Composites and Siemens Gamesa into India and Turkey [S4]. The named major players in the segment are Siemens Gamesa, GE Renewable Energy, Vestas, Nordex, MHI Vestas Offshore Wind, Suzlon, Goldwind, Envision Energy, and Senvion [S4].
Siting decisions now turn on three measurable inputs: (1) wind-resource class at the planned hub height, with 6.0 m/s annual average at hub treated as the commercial threshold; (2) capacity factor, which for U.S. onshore spans 5–50% and averages 38%; and (3) grid and curtailment risk, where U.S. wind curtailment averaged 5.5% in 2024, with Southwest Power Pool at 10.5% and PJM at 0.3% [S3]. For a blade plant, those same three numbers decide whether the turbines leaving the line will be dispatched or curtailed, which decides whether the customer can underwrite a 20 year service contract [S3].
Driver #5: Market Sizing and Where the Volume Is Going
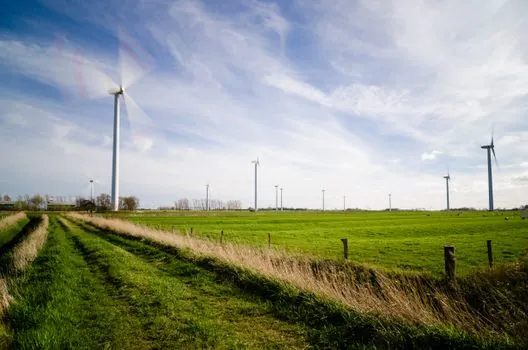
The demand envelope behind the capacity decision is concrete. Wind generated 10.3% of U.S. electricity in 2024, and the resource studies cited by the University of Michigan Center for Sustainable Systems put global onshore plus offshore wind potential at 872 PWh/yr at 90 m hub height, more than 30x the 27 PWh used globally in 2023 [S3]. Wind project costs have fallen 71% since 1983 to $1,694/kW in 2023, and the average LCOE for onshore wind reached $49/MWh in 2022, down 58% since 2012 [S3].
That cost curve is what keeps pushing planners toward larger blades: a 3.4 MW turbine with a 133.8 m rotor produces more energy at lower wind speeds than a smaller unit, which expands the sitable footprint and improves project IRR [S1]. For a procurement lead, the data point to anchor on is that average hub height for U.S. onshore turbines is now 106 m and 124 m for global offshore, with land-based hub height up 83% since 1998–1999 [S1][S3]. Any new blade line below 100 m blade capability is already a stranded-asset risk in 2026. The secondary but real pressure is land use: large wind projects require roughly 85 acres per MW, so a 100 MW project occupies ~8,500 acres, and planners must integrate agricultural or dual-use terms into site permitting [S3].
Constraints, Failure Modes, and What the Numbers Don't Solve
Three constraints will bound any 2026 capacity plan regardless of market growth. First, the 20 year design lifetime combined with hard decommissioning at end of life means every new blade line ships into a 2040s recycling problem, not a 2030s one, and most current recycling routes are still pilot-scale [S2]. Second, transport geometry caps the practical blade length for any inland plant: no amount of factory automation overcomes a low bridge or a tight interchange [S1][S6]. Third, the composite-process defect rate is the binding cap on first-pass yield, and void-driven scrap directly erodes the 20.5% CAGR growth thesis if plants scale faster than their process control matures [S4][S5].
The decision gates that a 2026 capacity planner must clear, in order, are: blade length class and process route (hand layup vs VARI vs RTM), mold count and post-cure capacity, transport and logistics feasibility from the chosen site, end-of-life pathway for the blade class, and finally, a siting case anchored on a real 6.0 m/s wind resource and a curtailment profile under 6% [S1][S3][S5]. A line that fails any of those gates will run below nameplate utilization within five years of commissioning.
Trackable near-term signals to watch: new factory announcements in India and Turkey from the named blade OEMs, any published update to U.S. onshore average rotor diameter beyond 133.8 m, and a second commercial-scale deployment of flexible/slender blade designs that can clear tight road geometry [S1][S4]. For buyers and EPCs sourcing blades alongside process equipment, the wind turbine blade manufacturing equipment spec map ties the line-level decisions above to specific equipment gates. For context on how composite-heavy industrial capacity planning compares to other energy-intensive process industries, the titanium sponge demand and capacity map covers a comparable grade-and-capacity logic in a different metal. Material buyers should also monitor SANY Renewable Energy blade product line updates only where flow instrumentation inside resin plants ties to the same capacity expansion, since blade layup uses metered resin and hardener feeds where a flow meter and pressure transmitter spec can gate first-pass yield.
For component-level specifications, see turbine flowmeter.