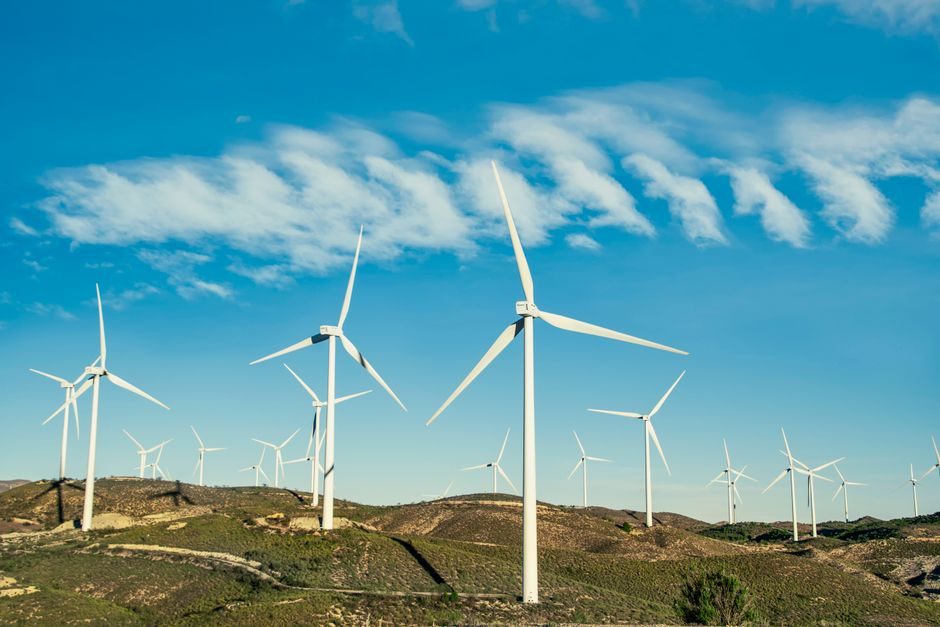
The wind turbine gearbox market is segmented by type into main gearbox and yaw gearbox, and by installation type into new build and replacement, with the global market covered across North America, Europe, Asia-Pacific, and LAMEA through 2027 [S2].
A wind turbine gearbox sits between the low-speed rotor shaft and the high-speed generator input; the design governs how efficiently the drivetrain converts wind torque into usable electrical output, and is the highest-failure component in the turbine powertrain [S2][S3]. A 2015 industry primer notes the gearbox raises shaft rotation roughly 50x versus blade rotation, which is the key reason bearing, gear-mesh, and lubrication loads concentrate in this single sub-assembly [S3].
Market Scope and Segmentation Anchors
Scope is the installed base of wind turbines rather than total wind-energy capacity, because gearbox value follows machine count and unit rating, not nameplate megawatts alone [S2]. The forecast window runs to 2027 with February 2026 as the latest reference month, segmentation by type (main gearbox, yaw gearbox), installation type (new, replacement), and application (onshore, offshore) [S2].
Main gearboxes carry the drivetrain torque step-up; yaw gearboxes handle nacelle yaw alignment and are smaller, lower-cost units with shorter replacement cycles. The report explicitly frames type as main vs yaw and application as onshore vs offshore, two cuts that determine both volume and unit price [S2]. Regional cuts are North America (U.S., Canada, Mexico), Europe (France, Germany, Italy, Spain, UK), Asia-Pacific (China, Japan, India, South Korea, Australia), and LAMEA (Brazil, South Africa, Saudi Arabia, UAE) [S2].
Onshore vs Offshore vs Replacement: Selection Criteria
Onshore is the volume base case — smaller machine ratings, lower specific gearbox cost, and the segment most exposed to the failure-rate drag on margins [S2]. Offshore turbines trend to higher ratings and more demanding duty cycles, which pushes gearbox unit price up and elevates the value of designs qualified for high mean-time-between-repair numbers. For a deeper look at how this interacts with blade composite choices and vessel logistics on the offshore side, see the Wind Turbine Blade Market 2026 sourcing map.
Replacement demand is driven by failure rates of installed gearboxes and the cost of restoration [S2]. Across the wider wind services market, the same February 2026 reference report frames the aftermarket split by type (OEMS, Independent Service Providers, WFO / in-house, others) and by application (onshore, offshore) [S1]. The high failure rate acts as both a market driver (replacement demand) and a market restraint (high restoration cost), creating a two-way pull on unit economics.
Key Selection Criteria: Power Density, Reliability, Lubrication
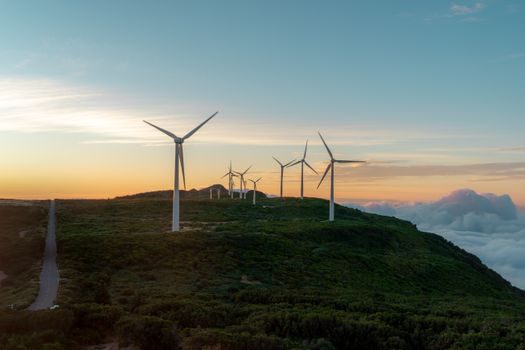
Three engineering gates dominate gearbox buying decisions: torque density (kNm per stage), documented reliability (gearbox-side mean time between failures / replacements), and lubrication system design (synthetic PAO or PAG gear oils with sump volume, filtering class, and heat-exchanger integration) [S2][S6].
The supporting lubricants market provides a useful proxy for the underlying machinery base: the global wind turbine lubricants market is projected to reach US$ 605.64 million by 2034 from US$ 244.58 million in 2025, at a 10.6% CAGR for 2026-2034, driven by renewable-energy build-out and high-capacity offshore wind farms [S6]. Higher-performance synthetic lubricants extend drain intervals, reduce unscheduled maintenance, and are a direct lever for cutting the lifetime cost of gearbox ownership [S6]. Casting supply for hubs, nacelle frames, and rotor hubs — the structural side of the same turbine — is forecast to reach $3.62 billion by 2031 at 6.2% CAGR (2025-2031) [S7].
Regional Sourcing Map and Sourcing Risk
Europe holds a significant share of the global wind turbine gearbox market because Germany, Italy, and France host major gearbox system manufacturers, while Asia-Pacific is expected to grow at a significant pace on rapid infrastructure development and renewable adoption in developing economies [S2]. China and India are the largest hubs of the broader wind industry, which makes them the principal supply-chain chokepoints when logistics are disrupted [S1].
OEM-owned service organizations, independent service providers, and WFO (in-house) utility teams all compete in the aftermarket, with the services report explicitly enumerating those four service types alongside onshore and offshore applications [S1]. For an adjacent renewables-side sourcing view that intersects with storage and grid build-out, the grid-scale battery storage 2026 sourcing map lays out the parallel component-pressure picture for the storage side of the same renewable build cycle.
Failure Modes, Standards, and Engineering Constraints
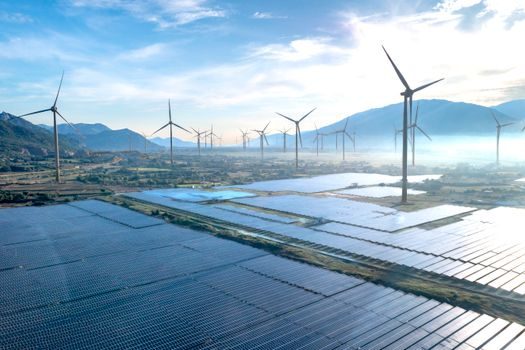
Wind turbine gearboxes fail disproportionately because of fluctuating wind loads combined with high step-up ratios, which makes bearing life, gear-mesh contact stress, and oil cleanliness the binding design constraints [S2]. The COVID-19 disruption period is a documented case study in how lockdown-driven delays and supply-chain shocks in China, India, and Spain pushed new wind power project commencement out, constraining factory throughput and aftermarket parts availability [S1].
ZF Wind Power has publicly demonstrated that engineering simulation in the gearbox design loop — finite-element analysis of gear contact, bearing dynamics, and lubrication regimes — directly improves efficiency and reliability of production wind turbine gearboxes [S8]. Cleanpower.org, cited in that case study, puts wind at 10.2 percent of the country's electricity. electricity supply, framing the absolute scale of the installed base that the gearbox aftermarket must serve [S8].
Decision Comparison: Main vs Yaw, Onshore vs Offshore
For a procurement or design decision, the four-way cut behaves predictably: main gearboxes drive revenue per turbine and dominate replacement spend; yaw gearboxes are lower-cost, higher-volume-per-fleet units with shorter cycle lives [S2]. Onshore brings higher unit volume and lower unit price; offshore brings higher unit price and stricter reliability qualification [S2]. Replacement demand is structurally tied to in-service failure rates, while new-build demand follows turbine installation counts; both move with the same wind-services O&M cycle, segmented by OEMs, ISPs, and WFO teams [S1][S2].
The adjacent casting supply chain (hubs, nacelle frames, rotor hubs) at $3.62 billion by 2031 (6.2% CAGR, 2025-2031) [S7] and the lubricant pool at $605.64 million by 2034 (10.6% CAGR, 2026-2034) [S6] are the two strongest co-moving indicators for gearbox demand because they scale with the same installed fleet.
Trackable signals over the next reporting window: the February 2027 update of the Allied wind turbine gearbox report (report code A10751) for revised regional and segment splits [S2], and the parallel February 2027 update of the wind services report (report code A09295) for aftermarket mix shifts across OEMs, ISPs, and WFO providers [S1].
Detailed specification references: gearbox, turbine flowmeter, and pressure transmitter.