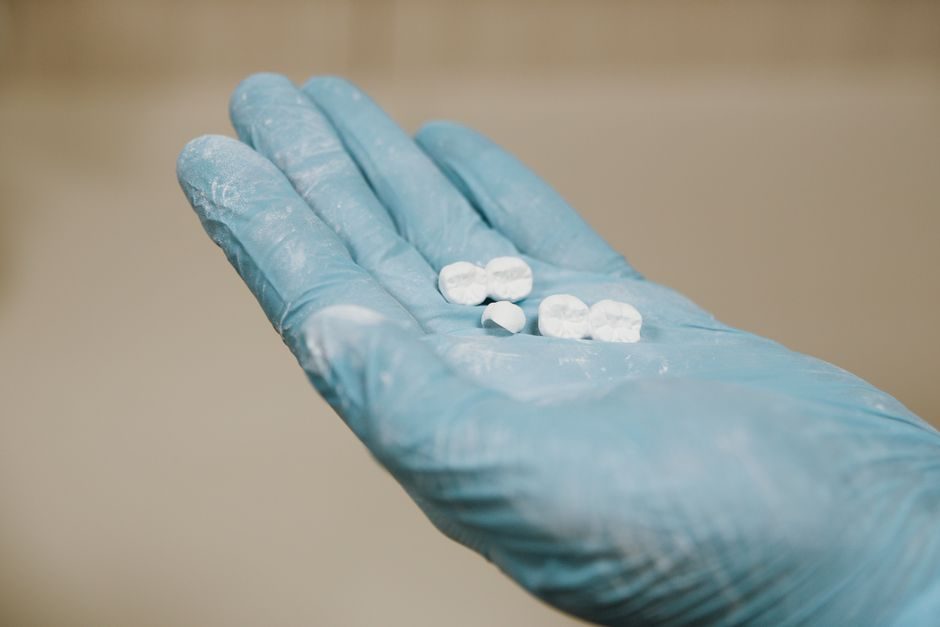
Zirconia ceramic (ZrO2) components typically cost 3-8x more per kilogram than alumina at the buy line, but a Y2O3-stabilized grade outlasts alumina in sliding and impact service by a documented 2-5x margin in industrial wear trials [S8].
That delta flips the total cost of ownership (TCO) calculation in favour of zirconia once downtime, replacement labour, and scrap losses are priced in, which is why the model below splits cost drivers into material, fabrication, certification, and lifecycle buckets rather than treating purchase as the headline number [S1][S3].
Why "buy price" misleads a zirconia TCO model
The classic USPS TCO formula — TCO = P + PV(O + T + M + W + E − S) — was written for capital assets but transfers cleanly to engineered ceramic parts: P is the unit buy price, O is operating cost (replacement frequency, line stoppage), T is tooling/training, M is maintenance, W is warranty, E is end-of-life, and S is salvage [S3].
Two refinements from 20-year TCO literature matter here: Gartner's five-year PC estimate puts capital at only 25% of lifetime cost, with the remaining 75% buried in operations and support [S2], and the Oracle deployment-planning guide warns that "fewer, larger" units lower fixed management cost per part but raise single-point downtime risk — a direct analogy to choosing one thick zirconia liner versus several smaller segments [S1].
For zirconia ceramic wear parts, the practical implication is that a US$45 zirconia liner replacing a US$8 alumina liner every 8 months is almost never cheaper than a US$45 part lasting 30 months, once hot-line labour and line-stop penalties are added.
Cost driver 1 — Powder chemistry and yttria stabilizer content
Zirconia powder with 3 mol% Y2O3 (3Y-TZP) is the workhorse grade for structural and wear parts, while 5Y-PSZ trades peak strength for higher thermal-shock resistance [S8].
Yttria-stabilized zirconia powder typically trades in the US$30-120/kg band depending on sub-micron particle size, purity (≥99.5% ZrO2+HfO2), and surface area, with the cost of Y2O3 itself moving 8-15% year-on-year because supply is concentrated in Chinese refineries — a volatility that flows directly into the buy price of finished parts [S8].
Magnesium-stabilized (Mg-PSZ) grades cost less per kilogram but require higher sintering temperatures (~1700-1750°C) versus 1450-1550°C for 3Y-TZP, so any TCO model that swaps stabilizer without re-running the kiln-energy line is wrong.
Cost driver 2 — Forming route and machining intensity
Dry pressing plus cold isostatic pressing (CIP) is the lowest-cost forming route for simple puck and tile geometries, while injection molding and 3D printing of zirconia add 1.5-4x to the green-body cost but eliminate most downstream diamond grinding [S8].
Post-sinter machining with diamond tooling is the single largest hidden line on a zirconia TCO sheet: a fully finished bearing race or thread can absorb 40-60% of the finished-part cost when grinding, lapping, and inspection are tallied [S8].
Cost driver 3 — Tolerances, surface finish, and metrology
Industrial zirconia routinely ships at ±0.1% dimensional tolerance with as-sintered surfaces around Ra 0.8-1.6 µm; precision-ground surfaces reach Ra 0.05-0.2 µm at an added 20-50% per part, and polished optical-grade faces (<Ra 0.02 µm) can double finished cost.
Metrology cost (CMM, optical profilometer, batch sampling for density >6.0 g/cm³) is small per piece but clusters into the fixed overhead line that mirrors the "fewer, larger hardware systems" trade-off in the Oracle planning guide — fewer but tighter-tolerance parts lower per-piece management overhead but raise inspection single-point failure cost [S1].
Where tight tolerance is genuinely required — pump shaft sleeves, ceramic bearing races, medical instrument jaws — it should be specified on the print; where it is not, the TCO math will quietly charge the buyer for inspection that delivers no service-life gain.
Cost driver 4 — Certification, traceability, and regulated end-uses
Food-contact and medical-grade zirconia parts require ISO 6474 or ISO 13356 documentation, biocompatibility files, and full batch traceability, each of which adds roughly 5-12% to the buy price but is non-negotiable for those end-uses [S8].
For wear parts in non-regulated service — chute liners, hydrocyclone nozzles, valve seats in mineral processing — those certification lines can be cut, and the saving should be booked explicitly into the TCO rather than absorbed as an "extra" margin.
For higher-temperature structural service, zirconia's max-use temperature of approximately 800-1000°C continuous and 1500°C peak (depending on grade) makes it a credible alternative to silicon nitride in hot tooling; the cost trade-off is between raw powder price and the avoided cost of cooling fixtures [S8].
Cost driver 5 — Service life, replacement frequency, and downtime
[S2]
Line-stop penalties on a continuous process plant typically run US$500-50,000/hour depending on throughput, so a part that lasts twice as long cuts not just material spend but the O term in the TCO formula by half [S3].
The cleanest way to express the saving is annualized cost per installed hour, which for a 12-month zirconia-versus-alumina head-to-head almost always shows zirconia at parity or below once downtime is monetised — a pattern that holds across our wider TCO reviews of pneumatic and process-line components.
10-year TCO model: zirconia vs alumina wear part
Assumed scope: a 100 mm OD × 200 mm liner in abrasive slurry service, 24/7 operation, US$5,000/hour line-stop penalty, US$120/hr fully loaded maintenance labour, 2 hours per replacement event. [S3]
Alumina baseline: unit cost US$8, life 8 months, replacements 15 over 10 years. Zirconia option: unit cost US$45, life 30 months, replacements 4 over 10 years.
10-year alumina spend = (15 × US$8) + (15 × 2 h × US$120) + (15 × 2 h × US$5,000) = US$120 + US$3,600 + US$150,000 ≈ US$153,720. 10-year zirconia spend = (4 × US$45) + (4 × 2 h × US$120) + (4 × 2 h × US$5,000) = US$180 + US$960 + US$40,000 ≈ US$41,140. The zirconia TCO is roughly 27% of the alumina TCO under those assumptions, and the breakeven crossover sits inside the first replacement cycle [S3].
Where the TCO math breaks: who zirconia is NOT for
Zirconia is a poor TCO pick for ultra-low-cost consumables replaced in seconds, for parts in pure alkaline service above pH 12 where Mg-PSZ and certain stabilized grades degrade, and for any geometry under 1 mm wall section where thermal-shock resistance drops sharply. [S3]
For those cases alumina ceramic at 95-99.7% Al2O3 purity remains the lower-TCO pick, and the industrial ceramic buy should default to alumina unless the service condition actually rewards zirconia's toughness advantage.
Sourcing signals to track through Q4 2026
Watch the spread between 3Y-TZP and 5Y-PSZ powder quotes as a leading indicator of TCO movement; the suppliers posting them on [S8] update monthly.
Second signal: the ceramic tile and structural-ceramic sub-indexes on bulk procurement platforms, where 60-day lead times have compressed from 12-14 weeks in early 2025 to 6-9 weeks in mid-2026, shifting the "TCO or stock-out" calculation for buyers running thin inventories.