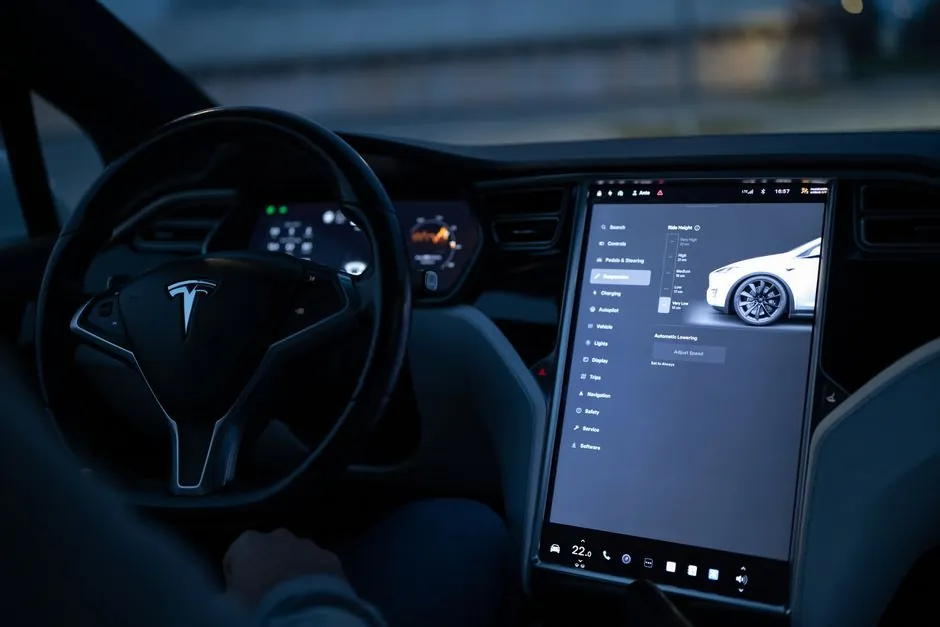
Global light vehicle output for 2026 is tracking around 97.8 million units, with battery electric vehicle (BEV) sales projected to reach 17.4 million units, a 19% year-on-year gain that lifts BEVs to roughly 19% of the worldwide vehicle market [S1][S5].
That production number breaks down into passenger cars and commercial vehicles, with light commercial vehicles alone reaching 22.2 million units (22.7% of the total) as e-commerce logistics fleets expand [S5]. The electrification story is no longer concentrated in one region: Chinese OEMs continue to dominate output, North America holds a high-margin truck and SUV base, and India's passenger market is growing fastest at 5.3% to 10.4 million units [S1][S7].
2026 Light Vehicle Sales: Flat Globally, Divergent by Region
Global new light vehicle sales entered 2026 at approximately 91.8 million units, essentially flat versus 2025's 91.7 million [S1]. S&P Global Economics' baseline of 2.7% global GDP growth for 2026, down marginally from 2025, frames a cautious demand backdrop, with semiconductor chip shortages, tariff impacts, and high interest rates cited as the main headwinds [S1].
Regional splits are stark: Mainland China is forecast to lose roughly 267,000 units of sales in 2026 after pull-ahead demand in 2025, North America is expected to contract by about 590,000 units to 19.3 million (with Mexico down 8.7%, or around 137,000 units), and Western and Central Europe is projected to add 260,000 units to reach 15.4 million on improved real incomes and lower inflation [S1]. South Asia, led by India adding 400,000 units, is the single largest growth contributor at 10.4 million total [S1].
BEV Output: 17.4M Units in 2026, Electrification Mix Tilts Toward Hybrids
BEV sales are projected to grow 19% to around 17.4 million units in 2026, lifting BEVs to about 19% of global light vehicle sales, after a 29% surge in 2025 to roughly 14.6 million units (16.1% share) [S1]. Broader electrification, counting BEVs plus range-extended EVs and plug-in hybrids, is expected to reach 30% of global sales in 2026 [S1].
Industry bodies now treat hybrids and plug-in hybrids as core to the mix rather than transitional, a shift driven by tariff exposure, delayed infrastructure build-out, and uneven consumer adoption [S1]. China alone produced 1.55 million NEVs in July 2026, a 30% year-on-year jump that pushed the NEV penetration rate to 61% of that month's domestic output, even as fuel-vehicle production in the same month fell 27% to 980,000 units [S4]. The first two months of 2026 saw combined NEV output of 1.6 million units, with NEV penetration temporarily retreating to 40% of total auto industrial growth that ran 3.4% year-on-year [S6].
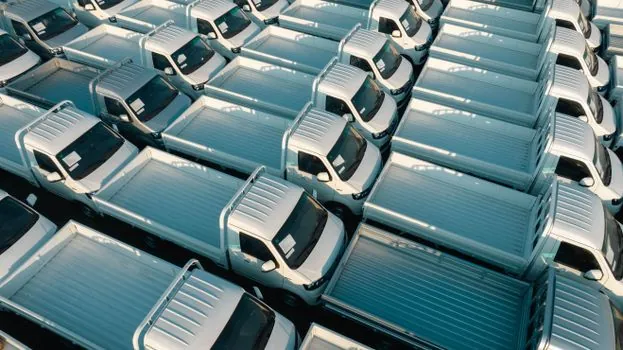
China's January 2026 auto production reached 2.45 million units, flat versus the prior-year month, with the passenger-car segment at 2.062 million (84.2% of the total) and commercial vehicles at 388,000 units (15.8%) [S3].
The structural shift toward larger utility vehicles and the parallel rise of NEV exports (302,000 units in the same period, up 100% y/y) underline China's dual role as the largest single national producer and the fastest-growing export base, even as conventional vehicle export volumes from China climbed 23.6% y/y to 93,000 units [S3]. January-July 2026 cumulative production reached 17.61 million units, with the automotive sector's value-added up 7.2% over the same window, well above the 5.3% industrial average [S8].
Regional Output Comparison: China Dominates EV, North America Holds High-Margin Trucks
China accounted for nearly 60% of global EV production in the run-up to 2026, with domestic OEMs BYD, Geely, and NIO expanding into Europe and Southeast Asia [S7]. North America (US, Canada, Mexico) is characterized by high-margin trucks and SUVs, with US light trucks and SUVs making up over 75% of new vehicle sales, a mix that maps directly onto the production programme [S5][S7].
South Asia is the fastest-growing volume region, with India adding 400,000 units of sales in 2026 to reach 10.4 million total [S1]. Europe is adding 260,000 units of sales to 15.4 million but is rebuilding share through mild growth rather than volume surge [S1]. For suppliers weighing capex, the structural read is clear: battery and power-electronics capex is concentrated in China and Korea-adjacent supply chains, while North American capex tilts toward truck and SUV platforms and India is the primary greenfield passenger-vehicle build-out region, a pressure that is reshaping tier-1 Tier-1 Auto Supplier Distress Reshapes 2026 Capex and Equipment Demand decisions across the board.
Production Constraints: Chips, Tariffs, and Battery Cost

DRAM and broader semiconductor chip shortages remain on the 2026 watch-list, with OEMs expected to absorb higher input costs rather than pass them through fully [S1]. Battery pricing remains the single largest swing factor for BEV cost parity; with NEV penetration in China already at 61% in July 2026, incremental gains are now driven by PHEV and range-extender variants rather than BEV-only line ramps [S4].
Tariff regimes, particularly in North America and Europe, are also slowing the launch cadence of BEV-dedicated platforms and pushing OEMs to retain hybrid powertrain options through the latter half of 2026 [S1]. On the materials side, lithium hydroxide monohydrate producers are navigating Lithium hydroxide crystallization control and impurity monitoring: 2026 process reference tighter impurity specifications as cell chemistries diversify, and the wider power-semiconductor market remains split rather than broadly oversupplied, with SiC and IGBT capacity mismatched by end-use Power semiconductors in 2026: split market, not broad oversupply.
Comparison Table: 2026 Regional Production and Electrification Snapshot
The table below synthesizes the 2026 regional read across the four headline dimensions engineers and procurement teams use to frame sourcing and capex decisions: production volume, BEV penetration, growth direction, and the dominant vehicle type. All numbers are drawn directly from the research sources cited. [S1]
What This Means for 2026 Sourcing and Capacity Planning

For production-equipment buyers, the 2026 read is a split market: China lines keep adding NEV capacity (the Jan-Jul 2026 cumulative of 17.61 million units confirms that throughput is not the bottleneck), while North American and European OEMs are stretching hybrid line retention and delaying some BEV-dedicated capex [S3][S8]. India's 5.3% regional growth makes it the primary greenfield passenger-vehicle site this year [S1].
Industrial buyers specifying pressure transmitters for paint shops, flow meters for coolant and battery-slurry lines, and industrial valves for cell and module assembly should expect 2026 order books to skew toward Chinese NEV plants, Indian greenfield sites, and North American truck and SUV lines, with European capex running cautious. Track the CPCA monthly retail print, the OICA quarterly production release, and the next S&P Global Mobility sales revision as the leading indicators for any 2026 H2 revision.