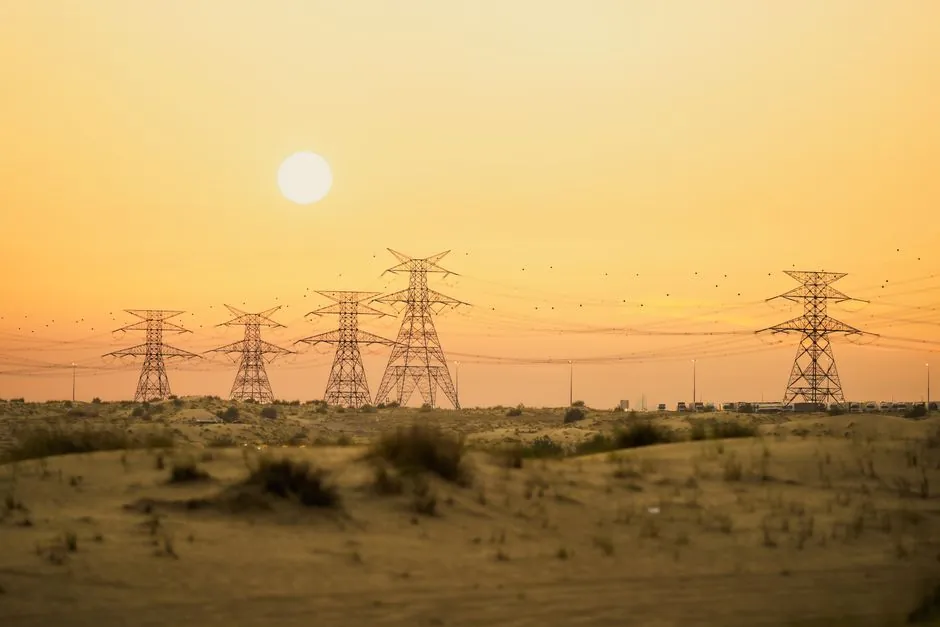
Global electricity demand is projected to grow at an average annual rate of 3.6% over the 2026-2030 period, roughly 50% higher than the 2.8% pace of the prior decade, per the IEA Electricity 2026 report [S5][S6].
The lift is concentrated in two end-uses: AI-driven hyperscale data centers and the manufacturing build-out behind them (solar PV, batteries, EVs). IEA puts global consumption at 33,600 TWh in 2030 versus 28,200 TWh in 2025, an addition of about 1,100 TWh per year [S5].
Data center load: from 104 GW to 290 GW in five years
Worldwide data center power demand is set to rise 27% in 2026 to 132 GW, up from 104 GW in 2025, and reach roughly 290 GW by 2030 [S3]. The US share is the most aggressive: an IEEE Xplore regional forecast (added April 2026) projects US data center energy use at about 600 TWh by 2030, or 10-12% of national electricity, with Virginia's data center share possibly doubling from the 2024 level of roughly 26% of state power [S1].
For US planners, the relevant gate is not just energy, it is peak. The same IEEE model shows ERCOT's summer peak climbing from about 85 GW in 2023 to roughly 145 GW by 2030 if no mitigation is added, a near-doubling that strains transformers, transmission corridors, and reserve margins simultaneously [S1].
Where the load lands: three interconnections, three different problems
The Eastern Interconnection (Northern Virginia's "Data Center Alley") and ERCOT face the largest absolute strain; the Western Interconnection sees meaningful but comparatively smaller impacts, per the IEEE regional model [S1]. The drivers behind the divergence are grid asset age, transmission constraints, climate peaks, state policy, and local data center density.
A practical side-effect is that US utility capex is now projected near $1.3 trillion across 2026-2030, funding about 374 TWh of new energy and over 45 GW of additional peak capacity, with one reported line item at $259 billion for generation alone [S4]. That capex envelope drives orders across power distribution switchgear, substation transformers, and the metering layer that bills hyperscale campuses.
Generation mix shift: coal down, solar up, gas holding
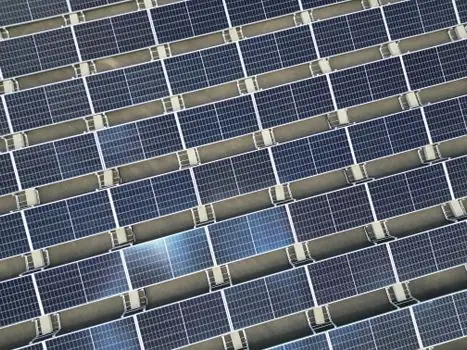
By 2030, low-emission sources (renewables plus nuclear) are projected to supply about 50% of global electricity, with renewable output expanding by roughly 1,000 TWh per year and solar accounting for over 60% of that increment [S5]. Global coal's share drops from 34% to 27%, with output declining about 0.9% per year on average over 2026-2030 [S5].
Regional trajectories diverge sharply. The common thread: gas and nuclear hold or grow in many advanced economies, while variable renewables require new power supply conditioning and storage at every interconnection point.
China and emerging economies set the demand floor
About 50% of the 2026-2030 global demand increment comes from China, and emerging economies as a group contribute over 80%, per the IEA [S5]. The growth mix is also shifting away from heavy industry: most of the lift now comes from solar PV, battery gigafactories, and data centers rather than from aluminum or steel.
The re-acceleration in rich-economy load is what makes the 3.6% global figure feel different from past IEA baselines.
Selection criteria for grid-side equipment buyers, 2026-2030
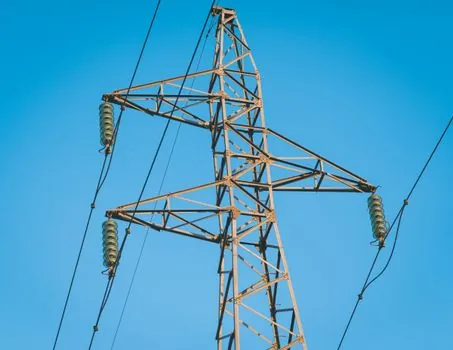
For utility and large-industrial spec teams, four decision gates dominate the 2026-2030 horizon: peak-load margin (transformer MVA headroom and short-circuit duty), renewable interconnection capability (grid-forming inverters, STATCOMs, dynamic line rating), data center campus power (medium-voltage power cable ampacity and harmonic tolerance), and metering/visibility (revenue-grade power meter accuracy class and substation telemetry). The first three are forced by peak growth in the 100-150 GW class; the last is forced by regulators wanting hourly carbon attribution for hyperscale loads. [S1]
For project owners evaluating technology options, the trade matrix looks like this: HVDC corridors win on long-distance bulk transfer and offshore wind tie-in, but lose on capex lead time (often 5-7 years for converter stations); EHV AC overhead remains the default for inland load growth under 300 km; modular gas peakers fill the 50-150 GW peak gap fastest (24-36 month build) but lock in CO2 if used for baseload. Battery energy storage system (BESS) durations are clustering at 4-hour for energy shifting and 1-2 hour for frequency regulation, with 2026 utility-scale installs commonly specified at 0.5-1.0 C rates.
Mitigation paths and what to watch in 2026-2027
The IEEE model concludes that proactive measures, including high-efficiency capacity, transmission upgrades, flexible data center operations, and clean energy integration, can keep the US grid reliable and on its climate path through 2030 [S1]. The harder constraint is siting and interconnection queue depth, not turbine or transformer production capacity alone.
Trackable signals through 2026-2027: ERCOT summer peak actuals versus the 145 GW 2030 line [S1]; the share of US utility capex allocated to transmission (versus generation) within that $1.3T envelope [S4]; and quarterly IEA revisions to the 290 GW 2030 data center power figure [S3]. For spec teams watching equipment lead times, transformer and HV power tool cable deliveries will be the earliest leading indicator of whether the 2026-2030 build is keeping pace with the 3.6% demand curve.
Related analysis: Stainless Steel Pipe Selection: 5 Gates Buyers Walk Through in 2026.