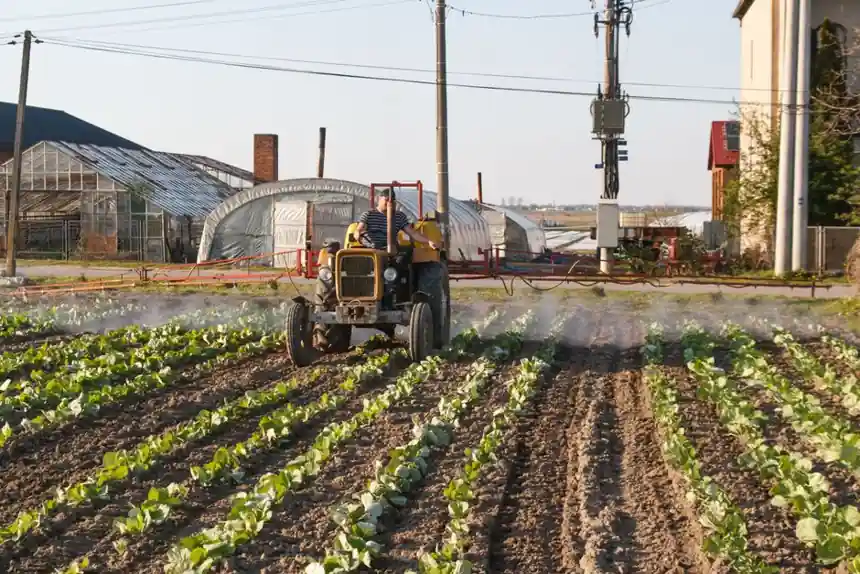
Retail anhydrous ammonia in Illinois reached $1,123 per ton on April 17, 2026, a 36% jump from the $828/ton average recorded between September 2025 and February 2026 before the Iran conflict closed the Strait of Hormuz [S2].
Twenty-eight percent UAN solution climbed 25% over the same window, from $436 to $543 per ton as of May 1, 2026, while DAP and potash moved only 2% to 3% because spring demand had already been satisfied [S2]. The shock is feedstock-driven, not logistics: roughly 50% of globally traded sulfur and over 30% of global urea exports transit the Strait of Hormuz, and 45 million of the 60+ million tons of fertilizer and raw material the Middle East ships each year move through that chokepoint [S3].
What the Conflict Actually Broke: Ammonia Capacity, Not Just Trade Flows
CoBank estimates 31 ammonia plants in the Middle East have been directly damaged or shut down by the conflict, with 49 additional plants in India, Pakistan, and Bangladesh curtailed or idled by constrained feedstock, and at least 20 Russian plants damaged by Ukrainian drone strikes [S3]. The 2022 Ukraine-driven shock rerouted trade flows; the 2026 event is a supply-side capacity loss with multi-year restart timelines, which is why NDSU projects 2027 retail averages of $496/ton urea, $666/ton DAP, $660/ton MAP, $619/ton ammonia, and $361/ton UAN, all sitting above pre-conflict 2025-2026 levels [S3].
Egypt and India, both of which source urea directly from the Persian Gulf, saw landed urea prices rise 92% and 86% respectively through the early 2026 spike, the clearest signal that the disruption is structural rather than transient [S7]. For U.S. retailers, exposure is asymmetric: domestic supply covers 67% of urea and DAP/MAP use, but the Persian Gulf still accounts for 12% of urea and 17% of DAP/MAP, which is enough share to set the marginal price on the import replacement barrel [S3].
Nitrogen Price Levels in February 2026: The Pre-Spike Baseline
Mid-February 2026 retail averages across the eight tracked fertilizers were $851/ton DAP, $879/ton MAP, $487/ton potash, $601/ton urea (a 5% month-over-month gain and the first print above $600 since early October 2025), $665/ton 10-34-0, $861/ton anhydrous ammonia, $411/ton UAN28, and $465/ton UAN32 [S4]. On a per-pound-of-nitrogen basis, urea ran $0.65/lb N versus $0.52/lb N for anhydrous ammonia and $0.73/lb N for both UAN grades, so anhydrous remained the cheapest nitrogen carrier per unit N even before its April run-up [S4].
Year-over-year against February 2025, every nutrient tracked printed higher: 10-34-0 +4%, MAP +9%, potash +10%, urea +12%, DAP +13%, anhydrous +15%, UAN32 +18%, and UAN28 +20%, confirming the structural inflation is broad, not nitrogen-specific [S4]. The Tampa ammonia benchmark had already settled near $487/metric ton by August 2025, with indications pointing higher in September, so the February retail print of $861/ton anhydrous implies roughly a 75% markup from the prior-year wholesale [S5].
Potash: U.S. Import Dependence and Trade-Policy Overhang
The United States imports nearly all of its potash, and Canada supplies the dominant share of those imports, leaving the 10% U.S. tariff on Canadian potash as a binding cost driver rather than a negotiating artifact [S1][S5]. Global spot potash ran $350 to $360/metric ton in mid-2025, roughly 21% above 2024, and U.S. wholesale sat on top of that with a tariff risk premium already priced in [S5].
By May 1, 2026, Illinois retail potash had edged from $493/ton pre-conflict to $505/ton, a 2% move, because most fall and early-spring potash had already been applied before February 28, 2026, when the Iran conflict began [S2]. The flat potash curve, in a market where farmers have cut phosphate and potassium applications by 10% to 15% over the past several years, is best read as demand destruction muting price spikes rather than as supply abundance [S3].
Decision Matrix: What a 2026/2027 Nitrogen Buyer Should Anchor On
For a U.S. corn grower comparing the three primary nitrogen carriers on the dimensions that actually matter, the table below ties the data points above to a sourcing decision. The four criteria are: current retail cost per pound of N, share of U.S. supply imported from the Persian Gulf, exposure to the Hormuz chokepoint, and 2027 forward price direction from NDSU. [S3]
Anhydrous ammonia remains the cheapest per pound of N at $0.52/lb N in February 2026, but it carries the largest absolute price jump (pre-conflict $828/ton to $1,123/ton by April 17, 2026, a $295/ton move) and 30%+ global trade flows through Hormuz, so it is the highest-volatility pick [S2][S3][S4]. Urea offers moderate cost ($0.65/lb N) and the highest direct Hormuz dependence at 45% of global exports, with NDSU projecting $496/ton for 2027, which still sits above the 2025-2026 baseline [S3][S4]. UAN28/UAN32 are the most logistically friendly (no anhydrous storage/handling) but the priciest per pound of N at $0.73/lb N, and NDSU has UAN at $361/ton for 2027, the lowest forward number in the basket [S3][S4].
The cleanest read: anything applied post-February 2026 carries the full shock, and farms that pre-purchased before February 28, 2026 will see limited 2026 cost impact but face the full increase in 2027 [S2]. Phosphate and potash exposure is real but slower-burning; the sulfuric acid feedstock that the Middle East also supplies is the watch-item for a 2027 DAP/MAP second wave [S2][S3].
Logistics and Sourcing Constraints That Will Outlast the Headlines
U.S. nitrogen supply remains structurally long on domestic capacity (67% of urea and DAP/MAP use), but the replacement barrel, the volume that sets marginal price when domestic plants run flat out, is Persian Gulf material at 12% of urea and 17% of DAP/MAP, both routed through Hormuz [S3]. Fertilizer movement on the Mississippi, the lower Illinois, and the Ohio River systems will set the regional basis between the Gulf import terminals and the Corn Belt application belt; the cooperative distribution data through March 2026 shows prices trending steadily higher since the 2025 summer fill, largely on ammonia and sulfur feedstock costs rather than rail or barge rate spikes [S6].
For an embedded-systems or industrial-board buyer, none of this directly changes component sourcing, but the same Hormuz and natural-gas feedstock economics that drive ammonia also drive hydrogen and nitrogen-derivative chemicals used in semiconductor and refining process gas, which is why equipment-side players should track the Ammonia cracker equipment supply readiness, Sept 2026: pilot, demo and fast-start pipeline as a second-order signal on Middle East ammonia plant restart timing.
Standards, Risk-Management Anchors, and Forward Trackers
Fertilizer grade, nitrogen content, and impurity limits are governed by the Association of American Plant Food Control Officials (AAPFCO) official terms and the international ISO 8157 vocabulary for fertilizer terminology, both of which set the definition of "urea (46-0-0)," "anhydrous ammonia (82-0-0)," "DAP (18-46-0)," and "MOP/potash (0-0-60)" used throughout USDA AMS and Illinois Production Cost Report price series [S1][S2]. The Maximum Return to Nitrogen (MRTN) framework from University of Illinois extension continues to drive corn nitrogen-rate recommendations on a cents-per-pound-N basis, and rates changed little despite the price spike, which is why most extension budgets still treat pre- and post-spike application volumes as equal for cost comparison [S2].
Two forward signals will determine whether the 2027 NDSU projections hold or undershoot: (1) restart dates for the 31 damaged or idled Middle East ammonia plants, with no confirmed restart in the research base; (2) sulfur price movement out of the Persian Gulf, where the Middle East supplies over 50% of globally traded sulfur, and a sustained sulfur spike feeds directly into the projected $666/ton DAP and $660/ton MAP 2027 averages [S3]. Until those two clear, expect retail ammonia to remain anchored near $1,000/ton, urea to chop in the $500 to $650/ton range, and potash to drift on demand destruction rather than on supply tightness.