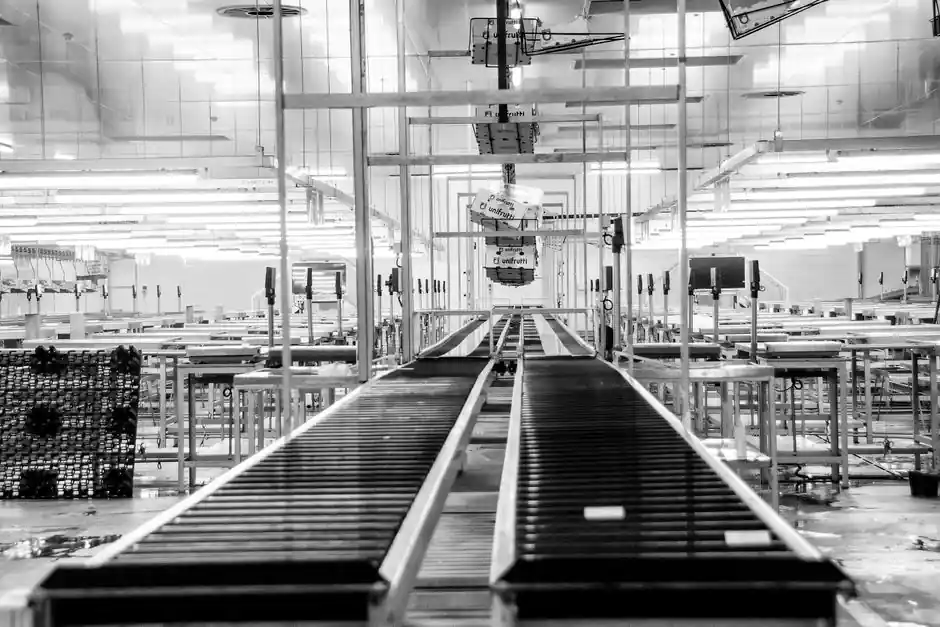
Battery energy storage system (BESS) installed cost in 2026 spans a wide band: roughly $100–$150/kWh for large utility-scale builds, $200–$400/kWh for commercial and industrial systems, and $400–$700/kWh or more for residential installs, with battery cells alone typically capturing 50–65% of total system spend [S1][S2].
The single biggest cost driver is the cell, dominated by lithium iron phosphate (LFP) chemistry in stationary applications. LFP runs 20–30% cheaper per kWh than NMC on a hardware basis, and a 2025 utility-scale pack-price floor of $70/kWh pulled four-hour system costs below $150/kWh in several tender markets [S2][S3][S4].
Pack and Cell Cost Trajectory
BloombergNEF data confirms battery pack prices for stationary storage fell to $70/kWh in 2025, a 45% single-year decline and the lowest level on record for any battery segment, while total installed system costs at utility scale typically run $150 to $250/kWh once balance-of-system, engineering, and installation are included [S3].
Raw materials account for over 70% of cell cost, making the pack-price floor sensitive to lithium carbonate spot pricing, which reversed sharply in H2 2025 and slowed the annual decline to roughly 10–15% for the year; the 2024 drop of approximately 33% was the steepest in recent years, and BloombergNEF forecasts a further 3% decline in global average pack prices in 2026 if raw material costs stabilize [S3].
The wider system view shows installed cost per kWh falling from approximately $1,000 in 2022 to about $600 in 2023, around $400 in 2024, and $200–$400 in 2025, with a 2026 forecast of $180–$350, a curve driven by lower lithium carbonate prices, LFP adoption, and manufacturing scale [S3].
Balance-of-System (BOS) and Component Shares
The power conversion system (PCS) typically represents 10–15% of total cost, the container and cooling system another 10–15%, and the balance of system (BOS) 10–20%, with cells filling the remaining 50–65% of installed cost at utility scale [S1].
LFP cells use abundant iron and phosphate materials, eliminating the need for costly cobalt or nickel found in NMC, and offer a cycle life of 6,000–10,000+ cycles versus 2,000–3,000 for NMC, plus a higher thermal ignition point that reduces fire risk; over a full project life, the longer service life and lower replacement risk translate into a substantially better levelized cost of storage (LCOS) [S2].
Inside the balance-of-system block, an effective battery management system (BMS) and supporting instrumentation are required to keep state-of-charge, cell balancing, and thermal limits within design margins, while the PCS, transformers, and switchgear handle grid-tie and reactive power functions, and the thermal management subsystem (air or liquid cooling) keeps the cells inside their operating window across charge/discharge cycles.
LCOS, Capacity Cost, and Lazard's 2026 Reading
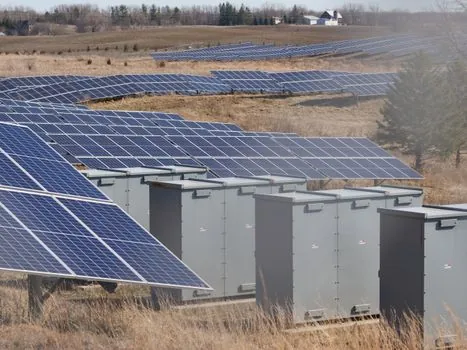
Lazard's 2026 Levelized Cost of Energy Report puts the LCOS for a 100 MW, four-hour BESS at approximately $210/MWh to $292/MWh, with storage costs overall up roughly 27% since 2020 due to higher capital costs, interest rates, tariffs, and ongoing supply chain pressures [S5].
LCOS is the ratio of total lifetime costs to total lifetime energy delivered, so a system with low upfront cost can become more expensive if it degrades faster or has lower round-trip efficiency, and a frequently overlooked cost is the electricity used for charging plus efficiency losses on the discharge side [S1].
For solar-plus-storage projects, utility-scale solar paired with energy storage carries an LCOE range of approximately $61/MWh to $156/MWh, versus $40/MWh to $98/MWh for standalone utility-scale solar, reflecting the added investment for dispatchability and grid firming, and the broader trajectory still shows utility-scale solar LCOEs down roughly 81% over the past two decades [S5].
Hidden and Site-Specific Cost Drivers
Beyond the headline per-kWh figure, permitting and inspection fees, fire code compliance, and the safety systems (suppression, deflagration venting, gas detection) that a utility or insurer will require can each add several percent to a project's true installed cost, and ongoing maintenance, monitoring, and software subscriptions stack on top of that [S2].
Degradation and warranty terms are the most commonly overlooked line items: LFP's 6,000–10,000+ cycle rating versus 2,000–3,000 for NMC changes when a developer must budget a mid-life augmentation, and U.S. projects can sit 20–30% above the global average for equivalent systems because of tariff exposure and supply chain localization requirements [S2][S3].
A separate but related layer is the battery rack and cabinet package plus the storage handling and installation workflow, both of which feed the 10–20% BOS share and tend to scale with site complexity rather than with nameplate capacity, which is why a 100 MWh-plus utility project benefits from bulk purchasing and standardized designs while a 10 kWh residential install carries the same fixed costs on a much smaller base [S1][S2].
Comparison: LFP vs NMC, Residential vs Utility, Pack vs Installed
LFP vs NMC: LFP is 20–30% cheaper per kWh on hardware, has a 6,000–10,000+ cycle life versus 2,000–3,000 for NMC, a higher thermal ignition point, and lower replacement risk, which together make it the preferred stationary-storage chemistry for residential, commercial, and most utility-scale projects today [S2].
Residential vs utility: a typical 10–13.5 kWh lithium-ion residential installation costs $6,000–$23,000 fully installed, with an 11.4 kWh system averaging approximately $9,041 and a Tesla Powerwall-class 13.5 kWh system at $8,400–$9,300 hardware-only before installation, against a $70/kWh pack price and $150–$250/kWh installed cost at utility scale [S3].
Pack vs installed: the headline $70/kWh figure is the battery pack only; the real utility-scale installed figure of $100–$250/kWh already includes PCS, container, cooling, and BOS, and that is before financing, interest rates, and the supply-chain or tariff adjustments that pushed the LCOS for a 100 MW, four-hour system to roughly $210–$292/MWh in Lazard's 2026 reading [S3][S5].
Market Sizing and Procurement Signals
The BESS market reached an estimated USD 82.80 billion in 2025 and is projected to grow from USD 97.10 billion in 2026 to USD 363.50 billion by 2035 at a CAGR of 15.8%, with Asia-Pacific commanding roughly 46% of the market, North America holding approximately 25%, and the Middle East & Africa the fastest-growing geography at a projected 20.2% CAGR [S4].
Lithium-ion batteries held an 82% share of the BESS market by technology type, and grid-forming inverter requirements are now expanding revenue streams beyond simple energy arbitrage, which is converting large-scale battery storage from a grid-edge experiment into a bankable infrastructure class [S4].
For a deeper dive on the instrumentation stack that actually moves these numbers on a daily basis, the BMS, PCS, PPC, and EIS layer comparison maps how the control layers interact with each cost block, and the BESS Industry 4.0 piece on AI-BMS, digital twins, and the 2026 adoption curve shows where software is starting to pull LCOS down again after the 27% rise since 2020.
Total Cost of Ownership Beyond Sticker Price
A complete TCO model must add charging electricity cost, round-trip efficiency losses (typically 85–92% for lithium-ion systems), annual maintenance ($150–$300 for residential, $500–$3,000 for C&I, variable at utility scale), monitoring subscriptions, and one or more mid-life augmentations if the cycle count exceeds the warranty [S1][S3].
For utility-scale procurements, two trackable signals to watch are lithium carbonate spot pricing (which reversed in H2 2025 and is the main upside risk to the 3% BloombergNEF 2026 decline forecast) and the standalone storage investment tax credit treatment under any successor to the U.S. Inflation Reduction Act, both of which can move the LCOS band for a 100 MW, four-hour system by tens of dollars per MWh [S3][S4][S5].