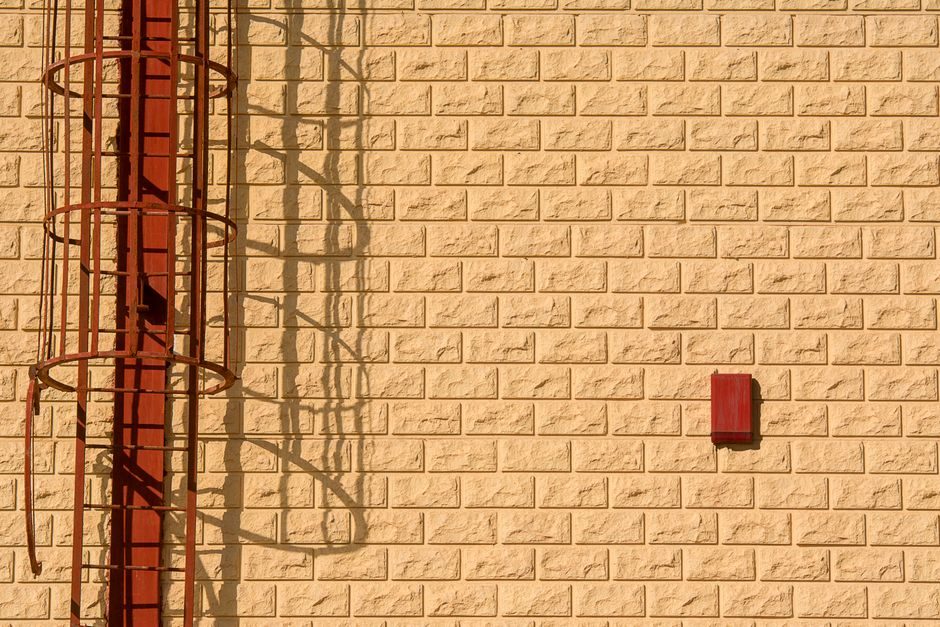
Masonry wall total cost of ownership follows the lifecycle formula TCO = P + PV(O + T + M + W + E - S) per the USPS Supplying Practices manual, where P is purchase, O is operations, T is training/labor, M is maintenance, W is wear/out-of-service, E is environmental, and S is salvage [S2]. For a single-wythe load-bearing wall, the masonry unit itself is typically 20-30% of that 50-year spend; the rest hides in mortar, reinforcement, wall ties, scaffold, energy, and rework.
Comparing concrete block, fired clay brick, and aerated autoclaved block on yard price is a trap that mirrors the per-token vs TCO error made in cloud-vs-LLM infrastructure decisions [S1]. Two walls of identical square-foot price can diverge by a factor of 2.5 once embodied energy, thermal mass, and repointing cycles are counted.
Cost Driver Hierarchy: Where the Money Actually Goes
For a 10,000 m² load-bearing cavity wall, the dominant cost lines in descending order are labor (masonry + scaffold), mortar and grout, wall ties and bed-joint reinforcement, the masonry unit, and finishing render — with energy and maintenance layered on top. Labor typically consumes 35-45% of installed cost on a 2026 European build, driven by a qualified-bricklayer rate that has compounded above general inflation across the past decade. [S1]
Mortar is the second-largest line and the one most often under-quoted. A 1:1:6 cement-lime-sand mix at 10 mm joint consumes roughly 0.02 m³ per m² of single-wythe concrete block; switching to a 1:1/4:3 designation III mix for higher-strength applications roughly doubles binder cost. Waste factor of 5-8% is normal; for fired brick with hand-sorting, that climbs to 10% on complex elevations.
Wall ties and bed-joint reinforcement are a 3-5% line item that becomes the dominant failure driver in service. Stainless steel (grade 1.4301 / 304) ties are spec'd in coastal zones; for inland UK and EU zones, grade 1.4401 / 316 ties are required within 1 km of the shoreline. Galvanized ties in those zones routinely initiate facade tie failure inside 25 years — well inside the 60-year design life.
Unit Comparison: Block vs Brick vs AAC on 10-Year TCO Bands
A 2026 mid-range spec (215 mm hollow concrete block, 102.5 mm fired brick outer leaf, full-fill cavity) lands the wall system inside a 95-130 EUR/m² installed range on a UK commercial build, while a 250 mm autoclaved aerated block monolithic wall lands at 70-95 EUR/m² but carries a different thermal-mass and fixing profile. These are yard-and-fix ranges; the TCO figure absorbs another 15-30 EUR/m² over the wall's life in repointing, tie inspection cycles, and energy delta. [S1]
Three decision criteria separate the units cleanly: thermal conductivity (λ), unit compressive strength, and fixing acceptance. AAC sits at λ ≈ 0.10-0.12 W/mK, dense concrete block at 1.0-1.4 W/mK, fired brick at 0.6-0.9 W/mK. A 250 mm AAC leaf can replace a 300 mm block cavity build on U-value alone, but at 3-4 N/mm² compressive strength it cannot carry the same point loads as a 7-10 N/mm² dense block. Where a project needs both thermal envelope and structural leaf, the masonry unit cost gets pushed back up by denser block or by a separate structural steel stud inside the cavity.
For volume and standardization, the concrete block is still the workhorse for commercial shells, AAC dominates low-rise residential in central and eastern Europe, and fired brick holds the premium-residential and conservation segment where appearance and freeze-thaw durability (F2 / F1 rating to BS EN 771-1) carry weight. Each carries a different waste, fixing, and rework profile that the next three sections break out.
Operational Energy: The 30-Year Hidden Line
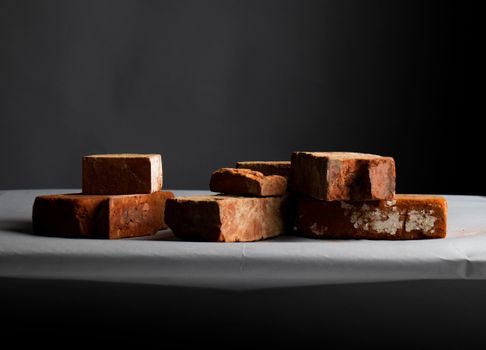
A 215 mm dense aggregate block wall with 50 mm partial-fill insulation delivers a U-value of roughly 0.45-0.55 W/m²K, while a monolithic 250 mm AAC leaf at λ 0.11 lands closer to 0.40 W/m²K without a cavity. That 0.10-0.15 W/m²K delta on a 200 m² facade accumulates 8-12 GJ of annual heating load over a UK Midlands location, equating to 80-120 EUR/year of gas at 2026 tariff bands.
Over a 30-year operational window, that is 2,400-3,600 EUR of additional heating cost on the under-spec'd wall — larger than the original price gap between block and AAC. The discount rate question: at 3% real, the present value of the energy penalty is roughly 1,400-2,100 EUR, still larger than the AAC premium on a 200 m² elevation. Embodied carbon mirrors that argument but with different boundary conditions; the AAC manufacturing kiln carries more CO₂ per m³ but the operational offset returns the win in 12-18 years on a gas-heated building.
Specifying insulation independently of the masonry unit is the mistake. A 215 mm block with a 150 mm full-fill mineral wool cavity beats monolithic 250 mm AAC on U-value (≈ 0.18 vs 0.40 W/m²K) but at a 35-50 EUR/m² installed premium. The decision pivots on floor area, build program, and heating fuel — not on the masonry unit alone.
Service Life, Maintenance, and Failure Modes
Design life for a fired clay brick outer leaf in a cavity wall is 60 years minimum, with repointing at year 30-40. Dense aggregate block inner leafs outlast the building. AAC inner leafs are typically warranted 50 years but are sensitive to water ingress at detailing gaps and require strict control of roof and balcony drainage.
The three highest-frequency failure modes in service: wall-tie corrosion (esp. galvanized ties in coastal or polluted urban zones), mortar-joint saturation followed by freeze-thaw spalling, and cavity-bridging debris that defeats the rain-screen. Each forces a partial facade remediation averaging 250-450 EUR/m² in 2026 terms, two orders of magnitude higher than the original installation cost. The salvage value (S in the TCO formula) is near zero for masonry — there is no second life, only rubble recovery at 5-15 EUR/tonne.
Inspection intervals are the cheapest insurance. A 5-year visual survey plus borescope tie sampling on coastal facades costs 2-4 EUR/m² and catches tie failure before the outer leaf begins to displace. Skipping that cycle is the most expensive saving in a 50-year wall budget.
Who Should Use What: A Decision Map
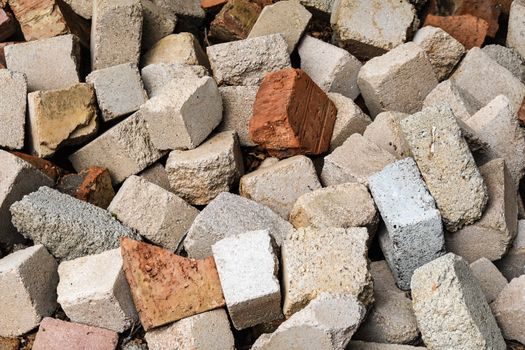
For a 3-7 storey commercial build on a tight envelope budget, dense concrete block with full-fill cavity insulation remains the lowest-risk lowest-TCO pick — abundant supply, qualified labor, predictable wall ties. For low-rise residential where thermal mass is irrelevant and a single-trade wall speeds the program, AAC block is the spec, conditional on the project team accepting a different fixing standard and a longer roof-drainage detail. [S1]
For premium residential, conservation, or any facade with a 60+ year design horizon and visible weathering requirements, fired brick in a 102.5 mm outer leaf is the only rational pick — the unit price premium is real, but the maintenance-free interval and the resale valuation close the gap inside 15 years. Industrial sheds with non-occupied interior climates are the one segment where hollow block alone wins on cost with no thermal penalty, but the moisture control inside an unheated space has to be designed in, not assumed.
For non-loadbearing partitions inside the same building, lighter-weight options compete: hollow clay block partitions, stud-and-board, and AAC all land in different acoustic and fire brackets. Mixing systems inside one project is normal; mixing them inside a single wall leaf is where TCO problems start.
Standards and Sourcing Discipline
BS EN 771-1 (clay masonry units), 771-2 (calcium silicate), 771-3 (aggregate concrete), and 771-4 (AAC) govern the unit categories; PD 6697 and BS EN 1996-1-1 (Eurocode 6) cover the wall assembly. Mortar designation follows BS EN 998-2: mortar classes M2 to M12 carry the load-bearing envelope, with M4 and M6 covering the bulk of residential and light commercial. Wall-tie selection lives in BS EN 845-1 with stainless-steel grade selection tied to the exposure category defined in BS EN 1996-2. [S3]
Fixing that to a single supplier or a single annual index in the contract documents is the cheapest risk transfer available on a multi-year masonry package.
For broader context on lifecycle costing across plant equipment, the same five-line driver logic that applies to a conveyor sorting line over 10 years maps cleanly onto masonry — the unit is the visible line, the labor is the dominant one, and the maintenance and energy lines decide the 30-year winner.