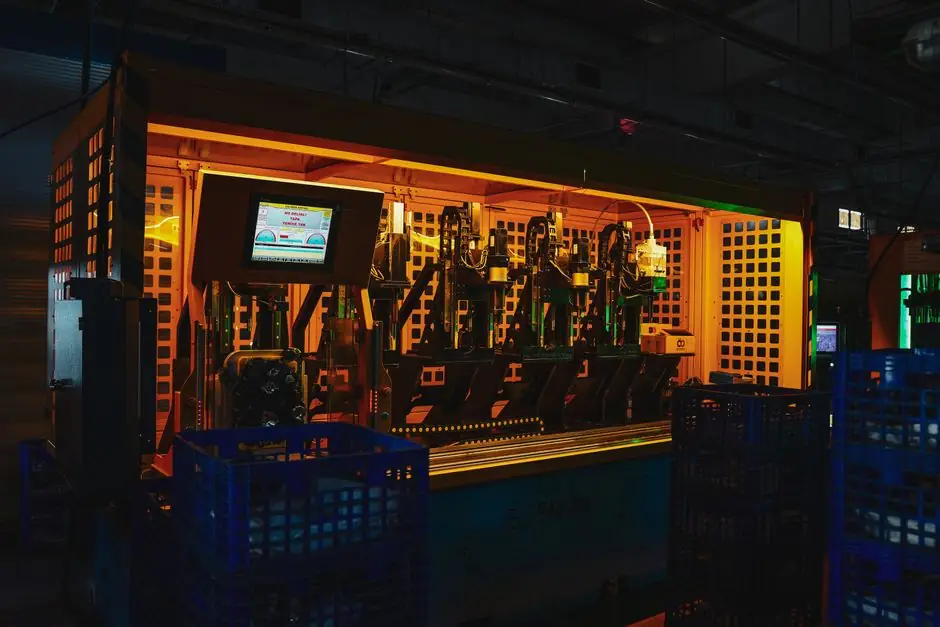
Brownfield projects in Indian manufacturing deliver 40–60% lower CAPEX per unit of added capacity than greenfield builds and shorten timelines by 30–50%, per IMARC Engineering guidance published June 10, 2026 [S3].
For a single production line, working budgets cluster between USD 1M and USD 5M for an AAC debottleneck or discrete-asset retrofit, while a near-full brownfield reconstruction of one line scales to USD 8M or more, with the gap driven by reusable autoclaves, structure, and utility capacity [S4].
What a "Brownfield Line Budget" Actually Covers
Brownfield expansion engineering bundles ten cost-bearing activities: existing-condition assessment, point-cloud as-built validation, debottleneck studies, piping tie-in, structural retrofit, electrical load upgrades, instrumentation integration, utility capacity evaluation, shutdown planning, and Management of Change documentation, per Rishabh Engineering's May 15, 2026 scope listing [S5]. Each line item carries its own cost envelope, and skipping one typically shows up later as a 20–40% cost overrun [S3]. The line-level budget should therefore be built as a WBS that maps every work package to a live asset, not as an equipment purchase order.
Budget Bands by Scope of Intervention
Three reference bands dominate line-level budgeting: (1) targeted debottleneck, USD 0.5–1.5M, covering cutting line, mold circulation, or batching upgrades on an AAC line where autoclaves and boilers remain serviceable; (2) partial modernization, USD 1–5M, retaining raw-material prep, building shell, and autoclaves while replacing controls, cutting, and packaging sections; (3) near-full reconstruction on a retained civil footprint, USD 5–8M+, where only land, structure, and selected pressure vessels survive [S4]. The honest test is the bottleneck map, not the nameplate: a 200,000 m³/year AAC asset that actually runs 130,000–150,000 m³/year often needs fewer than 12 new molds/hour to close the gap, which lands in band 1, not band 3 [S4].
Where the Money Goes on a Brownfield Line

For brownfield warehouse-and-line flows, Mecalux documents a 15,920-pallet automated site tied to production with ~100 pallets/hour outbound, a sizing signal that constrains upstream conveyor and sortation budgets proportionally [S1]. On the production side, IMARC's India 2026 dataset puts typical brownfield CAPEX at 40–60% below greenfield on a per-unit-capacity basis, with the savings concentrated in land (often zero), regulatory amendment (CTE/CTO modification rather than fresh EC), and shared utilities [S3]. Disciplined programs that retain this advantage hold schedule slip to under 10% and cost slip to under 10%; underweight planning programs run 25–50% late and 20–40% over budget on the same nominal scope [S3].
Selection Criteria: When Brownfield Beats Greenfield
Brownfield is the right call when the existing plant still owns three of five enablers: structure, utilities, autoclaves/pressure vessels, control backbone, and skilled labor. It is the wrong call when the layout ceiling is binding and expansion would require a second-shift utility build-out. Halocline frames the decision as restructuring versus greenfield substitution, not as a pure cost race [S2]. The Rishabh comparison matrix sharpens it: greenfield wins on layout flexibility, automation ceiling, and long-term capacity headroom; brownfield wins on initial capex, construction period, and minimal production disruption, but carries higher technical uncertainty [S5].
Comparison: Brownfield vs Greenfield vs New Line on Decision Criteria
Across four decision criteria for a single production line, brownfield upgrade, greenfield new line, and a full brownfield reconstruction diverge sharply. (1) Initial investment: brownfield upgrade is usually lower; greenfield new line is higher; near-full brownfield reconstruction lands between but skews toward greenfield cost when the retained asset base is small [S4]. (2) Layout flexibility: brownfield is limited by existing plot and structure; greenfield is unconstrained; partial brownfield is moderate [S4][S5]. (3) Construction period: brownfield upgrade is often shorter; greenfield new line is longer; near-full brownfield approaches greenfield duration because demolition dominates [S4]. (4) Long-term capacity ceiling: brownfield upgrade is often limited; greenfield is designed in; partial brownfield inherits the legacy ceiling minus bottlenecks removed [S4]. The decision driver is therefore not "brownfield vs greenfield cost" in isolation but "how much reliable saleable capacity per dollar of capex," which is why capacity-per-dollar is the metric that should anchor the budget review [S4].
Failure Modes That Blow the Budget
Three failure patterns recur in cost over-run cases. First, using nameplate capacity instead of measured cycle time and section utilization, which leads to oversizing the new equipment by 30–50% [S4]. Second, replacing equipment that is not on the critical path, such as a faster cutting line behind an unchanged autoclave, which adds capex without lifting output [S4]. Third, skipping existing-condition assessment and Management of Change, which forces field redesign during the shutdown window and extends it by weeks, with each extra week of shutdown on a USD 4M project typically adding 2–4% in idle-line cost [S5]. Rishabh's 2026 guidance is explicit: brownfield engineering is execution-focused, not design-focused, and the cost saving evaporates the moment the shutdown plan is treated as a checklist rather than a critical-path constraint [S5].
Standards, Sourcing, and Trackable Signals
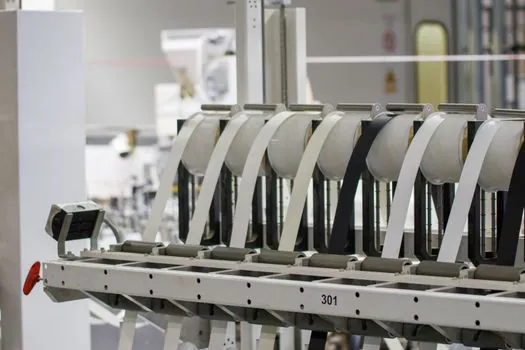
Line-level budget review should anchor on measurable per-unit metrics and a few external benchmarks. Useful signals to watch: IMARC's 2026 India manufacturing GVA growth above 7% in FY 2025-26 and IIP growth of 3% for April-September 2025-26, both of which correlate with brownfield capex deployment cadence [S3]; cumulative manufacturing FDI above USD 165 billion over the past decade per DPIIT, an indicator of capital availability for line retrofits [S3]; and AAC line-level reference points at 8–12 cakes/hour for cutting and autoclaving, which set the throughput envelope any modernization budget must defend [S4]. On the equipment side, molding line and automatic molding line upgrades remain the highest-leverage spend on brownfield AAC and foundry lines, while conveyor sorting line work dominates intralogistics brownfields sized like the Mecalux 15,920-pallet reference [S1]. For thermal and inspection scope, line frequency furnace and line scan camera retrofits are common mid-budget line items, and resin sand line rebuilds sit at the upper end of the band-2 budget range. Comparable automation-spend patterns on food lines, where similar bottleneck-mapping discipline applies, show up in the bakery and confectionery line automation 2026 stack.
Track, on the next planning cycle, whether the 40–60% CAPEX advantage holds at the line level for your sector, and whether the bottleneck map shortens the shutdown window below the 25–50% schedule-overrun band that underweight programs still hit [S3][S4].