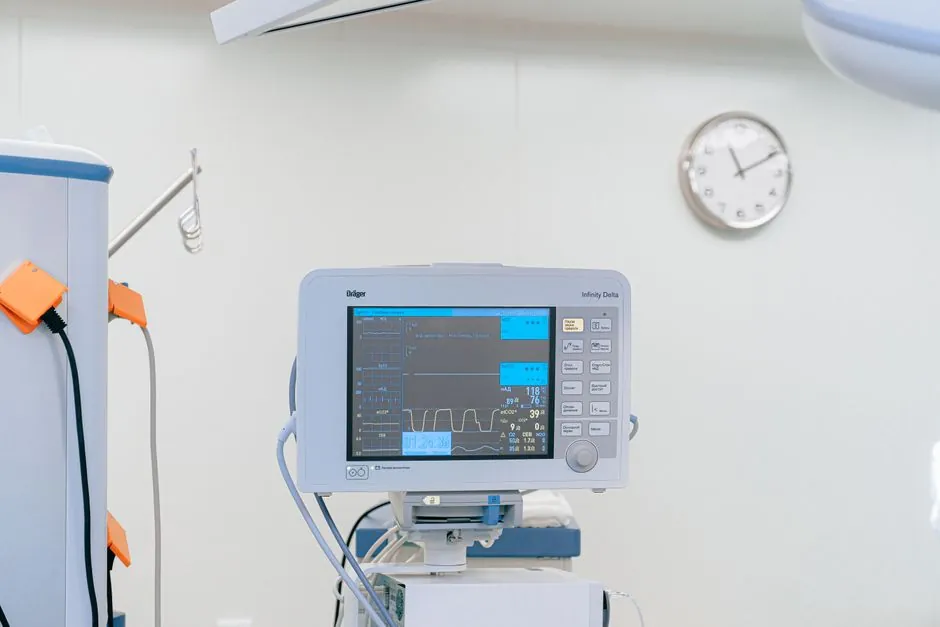
Raman spectroscopy has become a default in-line Process Analytical Technology (PAT) tool for bioprocess monitoring, quantifying substrate, metabolite, and product concentrations in real time without sampling [S1][S2].
Typical implementations use a 785 nm laser delivered through a fiber-coupled immersion probe, a probe-based WP 785 spectrometer covering 270-2000 cm-1 at 10 cm-1 resolution, and a thermoelectrically cooled detector, with 350 mW of excitation power reported in published fermentation work [S5].
Why Raman Beats NIR and Fluorescence in Aqueous Bioprocesses
Raman spectroscopy is based on inelastic photon scattering, where incident laser light shifts in energy according to molecular vibrational modes, producing a unique fingerprint for each species [S4]. The Raman signal of water is far weaker than the water absorption seen in near-infrared (NIR) spectroscopy, so the technique is highly suitable for aqueous systems such as bioreactors [S2]. Unlike fluorescence spectroscopy, which can only quantify molecules that fluoresce, Raman can in principle quantify every molecule present, allowing simultaneous tracking of multiple critical process parameters (CPPs) in one spectrum [S2]. Common biomarkers monitored upstream include glucose, lactate, and amino acids, with downstream flow cells extending the same probe architecture to protein quantification [S4].
Closed-Loop Control: On-Off, PID, and the Raman Feedback Path
A feedback controller's input is in-line information about a critical process parameter, while its output is the action that drives that CPP toward setpoint, and the proportional-integral-derivative (PID) controller remains the most used loop because it is easy to tune, robust, and simple [S2]. A simpler alternative, the on-off controller, has only two output states, on and off, and is sufficient when accuracy requirements are not excessively high, keeping a CPP within a defined band around setpoint without the tuning overhead of PID [S2]. For Raman to feed either controller, the spectrometer must return a calibrated analyte value on the same timescale as the loop, typically seconds to minutes for cell culture glucose and lactate tracking [S1][S4].
Direct-Insertion Probe vs Flow Cell: Where Each Architecture Fits
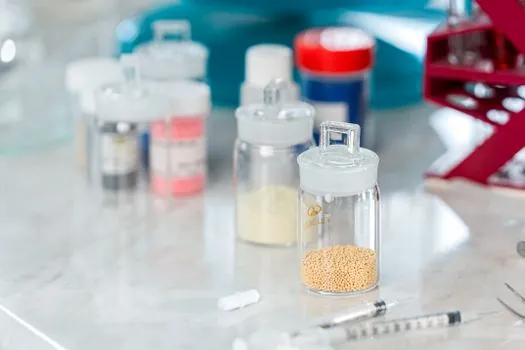
In upstream applications the Raman probe is inserted directly into the bioreactor, exposing the sample volume to the laser through a sapphire window, which avoids sampling lines and the associated residence-time lag [S4]. In downstream processing the continuous Raman measurement is often achieved in a flow-cell arrangement, where the same probe optics interface with a process stream leaving a chromatography skid [S4]. A 15 cm immersion probe with an interchangeable tip is one published geometry, and the same fiber can be reconfigured to different working distances for different vessel types [S5]. For new lab-scale PAT builds, off-gas Raman spectroscopy has also been demonstrated as a non-invasive route to real-time CO2 and pH inference [S10].
Chemometric Models: IHM, PLS, and Ready-to-Use Calibrations
Indirect Hard Modeling (IHM) is one published approach to extract analyte concentrations from bioprocess Raman spectra without requiring a full reference set for every component, and a 2024 study applied IHM to closed-loop control of substrate feeding in microbial cultivation [S2]. Benchmarking work has compared partial least squares (PLS) regression, principal component regression (PCR), and machine-learning regressors against IHM for upstream variables, with Raman's specificity reducing the number of latent variables needed for robust prediction [S7]. Ready-to-use Raman models from reagent suppliers are now packaged as off-the-shelf calibrations for glucose, lactate, biomass, and product titer, shortening deployment from months of in-house calibration to a site-qualification exercise [S9].
Selection Criteria: Wavelength, Probe, and Model Fit
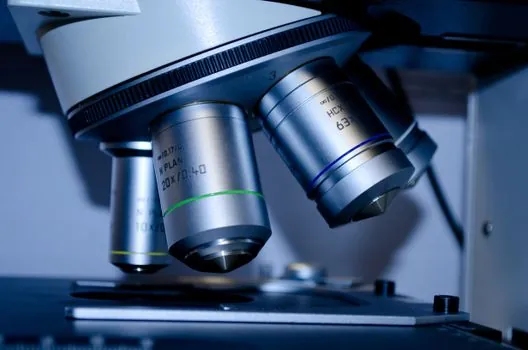
Three decision criteria dominate probe selection: excitation wavelength (typically 785 nm or 1064 nm to balance Raman cross-section against fluorescence), probe geometry (in-vessel immersion for upstream, flow cell for downstream), and the availability of a pre-built chemometric model for the target analytes [S5][S9]. Fluorescence background is the largest single interference in bioprocess Raman, and published PAT notes describe correcting for it with shifted-excitation subtraction and with multivariate filtering inside the calibration model [S5][S6]. For aqueous culture with strong biomass autofluorescence, 1064 nm excitation is often chosen to suppress the background at the cost of a weaker Raman signal, while 785 nm remains the workhorse for clear fermentation broths where signal-to-noise per milliwatt matters most [S6].
Limitations, Failure Modes, and Field-Mitigation
Process Raman spectra are sensitive to bubble formation, suspended solids, and probe fouling, and the 2005 MIT thesis on E. coli fermentation explicitly identified elastic scattering and wavelength drift as primary sources of systematic error in fiber-coupled systems [S3]. Online correction methods developed in that work, including wavelength-shift compensation and elastic-scatter correction, remain standard practice in modern PAT probes [S3]. Calibration drift across batches is the second failure mode, which is why ready-to-use models are usually delivered with explicit transfer protocols and reference standards rather than as standalone drop-in files [S9]. For full closed-loop qualification under FDA PAT guidance, the IHM or PLS model must be validated against at-line reference analytics (HPLC, biochemistry analyzer) across the design space of the run [S2][S4].
How Raman Compares with NIR, Mid-IR, and Fluorescence for PAT
On four common decision criteria the trade-off looks like this: water interference is high in NIR and mid-IR, low in Raman, and medium in fluorescence; non-invasive probe deployment is possible in all four, but only Raman and mid-IR can quantify non-fluorescent molecules; multiparameter tracking (glucose plus lactate plus amino acids plus biomass) in a single spectrum is strongest in Raman and weakest in fluorescence; capital cost is highest for mid-IR and lowest for NIR, with Raman sitting in the middle but offering the best specificity for cell-culture analytes [S2][S4][S6]. Process engineers in biopharma therefore default to Raman for upstream cell-culture PAT and reserve NIR for low-cost raw-material identification where the deeper water penetration of NIR is acceptable [S4][S6].
Operators in upstream bioprocessing who need to integrate Raman outputs with feed pumps and DO controllers will find practical pointers in the autonomous operations framework for process industries, where the Raman probe typically sits at Level 2 in the closed-loop hierarchy. For facilities weighing Raman against NIR for raw-material release, the relevant context is that Raman's specificity and water-insensitivity give it the edge inside the vessel, while NIR remains the cheaper route for at-line identity tests on powders and excipients [S2][S6]. Two trackable signals to watch: FDA PAT submissions that cite IHM-based Raman feedback control in their control strategy, and supplier disclosures of ready-to-use Raman calibration packages for new mAb and gene-therapy pipelines [S2][S9].
For component-level specifications, see condition monitoring system, power monitoring system, and vibration condition monitoring.