
Custom wire harness pricing in 2026 spans from $0.50 per unit for simple 2-5 wire assemblies at 5,000+ volumes to over $5,000 for mil-spec aerospace builds, with US-based production carrying a 30–60% premium over China and Southeast Asia manufacturing [S3].
Material cost dominates the bill of materials at 30–50% of total harness cost, labor adds another 15–25%, and connector selection can swing total assembly cost by up to 100× depending on whether the design calls for $0.10 crimp terminals or $50+ sealed automotive/mil-spec interconnects [S1][S3]. The North American wire and cable market alone was valued at USD 34.20 billion in 2025, projected to reach USD 35.41 billion in 2026 and USD 46.81 billion by 2034 at a 3.55% CAGR [S4].
Cost Structure: Materials, Labor, and Overhead
Materials absorb 30–50% of total custom harness cost, with copper wire alone accounting for 25–40% of that material line, and wire cost ranging $1.50–$8.00 per foot depending on gauge, insulation type, and rating [S1][S3]. Labor represents 15–25% of total harness cost, driven by wire cutting, stripping, terminal crimping, branch routing, taping, and final test steps that remain difficult to fully automate on complex multi-branch builds [S1]. For a complete view of how conductor and insulation choices feed the spec, see the cable and wire reference and the upstream wire rod material page.
Connector selection is the most under-modeled line item: entry-level basic crimp terminals run about $0.10, mid-range standard industrial connectors sit at $5–$15, and high-end sealed, ruggedized, or high-density solutions exceed $20 per mated pair, creating up to a 100× cost spread within a single BOM [S1]. That connector spread, multiplied across circuit count, frequently outweighs the visible copper surcharge in total assembly cost [S1].
Copper Volatility: The Visible 50% Surcharge
Global copper prices rose nearly 50% from early 2024 to February 2026 on electrification, renewable energy, and data-center demand combined with mining supply constraints [S1]. A 10% copper price index move translates into roughly a 3–4% harness cost increase, while the cumulative ~48.5% index rise equates to a 15–19% direct impact on harness cost, with high-power and large-gauge cables absorbing an even larger share [S1].
Tariff stacks compound the metal move: a 50% US copper tariff imposed in August 2025 has pushed material costs higher for domestic-sourced programs [S3]. For projects sensitive to cable and wire specification drift, the practical rule is to lock conductor cross-section early in the design phase, since each gauge step compounds both copper mass and connector crimp barrel size. A useful cross-reference for engineers sizing high-current runs is the upstream wire rod grade map, which sets the conductivity and tolerance floor before insulation and jacket decisions are made.
Connector Tier Comparison Across Cost Criteria

Decision criteria for connector selection on a cost-driven program typically resolve to four axes: unit price, assembly labor minutes per circuit, tooling/crimp-die investment, and qualification/inspection overhead [S1]. On those axes, basic crimp terminals at ~$0.10 win on price and cycle time but lose on environmental sealing and vibration performance; standard industrial connectors at $5–$15 balance cost with moderate sealing (commonly IP67) and tooled crimp dies; sealed automotive and mil-spec connectors above $20 add IP67/IP69K sealing, positive locking, and require controlled-process crimp monitoring plus pull-force validation [S1][S3].
A quantitative tier comparison: entry-level terminals at ~$0.10 with sub-30-second manual crimp cycles; mid-range industrial at $5–$15 with 45–90 second cycles and standard dies; high-end sealed at $20+ with 60–180 second cycles, application-specific crimp monitors, and serialized lot traceability for aerospace procurement programs [S1][S3]. The right tier depends on the operating environment: a sealed IP67+ connector is mandatory for under-chassis automotive and outdoor energy, while indoor control cabinets can run entry-level terminals without reliability loss.
Volume Tier Pricing: From Prototype to 5,000+ Units
Per-unit harness price collapses by roughly 10–30× as production moves from prototype to high volume, and the compression is steeper on simple harnesses than on complex ones [S3]. Concrete bands from 2026 production data: simple 2-5 wire harnesses go from $15–$50 at 1-50 units to $0.50–$3 at 5,000+ units; standard 5-20 wire builds compress from $50–$200 to $3–$15; complex 20-50+ wire harnesses move from $200–$800 down to $15–$60; high-voltage/EV harnesses span $500–$2,000+ at prototype and $40–$200 at scale; medical and aerospace harnesses hold the highest floor, sliding from $1,000–$5,000+ at prototype to $80–$400 at 5,000+ units [S3].
Non-recurring engineering (NRE) charges for custom tooling, dies, and fixture build can dominate low-volume runs and must be amortized separately from per-unit price; programs under 500 units frequently see NRE equal to or exceeding total piece-price cost [S3]. The 50% US copper tariff cited above interacts with NRE economics: a domestic prototype run for qualification followed by offshore production scale-out has become a common pattern to amortize the tariff only on the qualification lot, not on the volume build [S3].
Geography, Labor, and Total Cost of Ownership
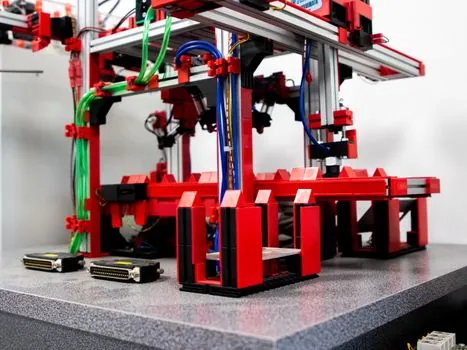
Manufacturing location is a first-order cost driver: China and Southeast Asia production underpins the per-unit price bands above, US-based production typically adds 30–60% on top of those figures, and Mexico falls between the two [S3].
Total cost of ownership (TCO) extends beyond piece price into installation labor, rework/scrap rate, field failure rate, and energy. Aerospace and medical harnesses, despite 80–400× the unit price of simple consumer builds, frequently win on TCO in low-volume safety-critical programs because field failure cost dominates piece-price savings [S3]. For programs blending sourcing risk with quality risk, a staged China sourcing verification workflow typically reduces both pre-shipment defect rate and the audit cost that drives total installed cost. Energy cost is minor relative to copper and labor on a per-harness basis, but high-current EV and utility cables can carry measurable resistive loss over their service life, which factors into TCO on infrastructure-scale deployments [S4].
Market Signals, Standards, and Trackable Drivers
Three 2026 signals are worth tracking. First, the global wire and cable market is projected to grow from $246.48 billion in 2026 to $410.70 billion by 2034 at a 6.59% CAGR, with the US segment alone expanding from $48.51 billion in 2025 to $56.78 billion at a 2.94% CAGR through 2034 [S5][S6]. Second, the North American underground installation segment held 58.4% share in 2025 and is the fastest-growing installation category at a 9.9% CAGR, while the high-voltage segment is expected to grow at 6.8% CAGR and aerospace and defense at 7.2% CAGR, both pulling copper intensity upward [S4]. Third, EV charging infrastructure passed 130,000 US charging points in 2023 per US Energy Information Administration data, and the Infrastructure Investment and Jobs Act continues to flow multi-year capital into grid and transportation cable demand [S4].
Watch the LME copper index month-over-month as the single highest-leverage leading indicator for harness cost; a 10% index move still maps to a 3–4% harness cost move under the relationship documented through February 2026 [S1]. For related spec-driven cost discussions, see the aerospace procurement cost discipline piece, which extends the same driver logic into mil-spec sourcing.
For the relevant spec sheets and selection criteria, see additive manufacturing material.