Capacity planning in wire and cable plants is shifting from ERP routing standards to measured line speed, OEE, and energy per meter, because real throughput on a drawing, extrusion, or cabling line routinely diverges from master-data speeds and silently breaks delivery promises [S1].
The commercial backdrop is the lever: the global wire and cable market is projected at $246.48 billion in 2026, growing to $410.70 billion by 2034 at a 6.59% CAGR, while North America alone is forecast to reach $46.81 billion by 2034 with the United States at 85.4% share in 2025, putting more volume through the same finite extruder hours [S4][S6].
Why standard line speed lies to the planner
ERP and APS systems typically schedule against a single standard speed per routing, but cable line speed in practice varies by conductor size, insulation compound, cable construction, color, drum size, tooling condition, operator, and customer spec, so a routing set at 300 m/min may run at 220 m/min on a humid Tuesday and 340 m/min on Friday with new compound [S1].
The failure modes are symmetric: a line running below its true capability loses output and inflates lead times, while a line pushed above its stable process window increases insulation defects, eccentricity excursions, and spark-test failures, with rework cost and scrap compounding the original "speed win" [S1].
End-to-end data capture of actual meters, downtime categories, energy per meter, and BOM material consumption against copper, aluminum, compound, and packaging norms is the only way to separate real capacity loss from planning fiction, and the captured actuals then feed back into ERP, APS, and BI for the next planning cycle [S1][S3].
The four process stages that define cable capacity
Cable capacity is the bottleneck of its slowest stage, and the standard process chain covers rod breakdown, wire drawing, bunching, stranding, insulation extrusion, screening, armouring, cabling, sheathing, rewinding, testing, and drum handling, each with its own critical speed, temperature, and diameter window [S1].
Insulation extrusion and sheathing lines are usually the binding constraint because of CCV (catenary continuous vulcanization) cure time, spark-test cycle, and cooling-trough length, while drawing machines are constrained by die sets, annealer output, and copper rod entry condition rather than line speed alone [S1].
Related reference pages on the underlying materials, including wire rod and finished cable and wire assemblies, frame where these bottlenecks originate versus where they are felt on the shipping dock.
How suppliers and consultants quantify the uplift
L.E.K. Consulting documented a 2026 engagement with a leading US wire and cable manufacturer that unlocked a 10%–16% income uplift through end-to-end supply chain performance work, spanning planning, procurement, manufacturing, logistics, and distribution rather than a single line-speed project [S2].
That engagement's levers map to the same signals BEEDIGIT-style MES platforms instrument: actual speed vs standard, OEE by line and shift, downtime classification across setup, drum change, material waiting, compound issue, tooling, maintenance, quality hold, and operator-related stops, plus micro-stops that disappear into manual reports [S1][S2].
The 10%–16% range is consistent with typical OEE programs in wire and cable, where OEE in many plants sits in the 50%–65% band, leaving headroom that is not visible until meters, drums, and energy are measured at machine level rather than estimated from ERP routings [S1].
Where ERP stops and MES starts
ERP plans the business and APS schedules capacity, but neither measures what really happens on the drawing, extrusion, or cabling machine, so speed, downtime, and energy losses stay invisible until end-of-shift rollup, by which time the offending batch is already on a drum [S1].
Dynamics 365 Business Central deployments for the cable and wire industry in 2026 emphasize real-time insight into production and tooling availability, better scheduling, capacity planning, and reduced downtime, with die inventory visibility flagged as the hidden complexity that makes or breaks a changeover plan [S3].
The practical split is: ERP/APS owns order promising, rough-cut capacity, and long-lead material calls, while the MES layer owns real line speed, scrap per meter, energy per meter, drum genealogy, and operator digital job orders on industrial tablets, and the two systems exchange actuals rather than competing for the same truth [S1][S3].
Selection criteria for a capacity-planning toolkit
Four decision criteria separate a useful capacity-planning stack from a dashboard: (1) machine-level capture of meters, speed, and energy at cycle frequency, not shift rollup; (2) downtime taxonomy that maps to planning categories such as setup, drum change, tooling, and quality hold; (3) BOM and material reconciliation so copper, aluminum, and compound variance rolls up to cost, not just to the floor; (4) bidirectional ERP/APS feedback so the next plan is built on the last run, not on a static standard [S1][S3].
Vendors and platforms differ mainly on integration depth: lightweight OEE packages answer "are we fast enough" but leave ERP untouched, while MES-grade platforms feed actuals back to Business Central or equivalent ERPs and update routing standards automatically, which is the configuration behind the documented 10%–16% income uplift [S2][S3].
For plants running a mix of lighting equipment and electric lamps harnesses, control cable, and power cable, the same toolkit is reused because the instrumented signals (line speed, diameter, spark test, drum count) are common even though the SKU mix is not.
Limitations, failure modes, and what not to optimize
Instrumenting a cable line without classifying downtime and reconciling to BOM gives a faster-looking factory on paper, because the MES reports higher OEE while scrap, compound overuse, and copper giveaway continue off-ledger, a failure mode that has undone several "line speed" projects in this industry [S1].
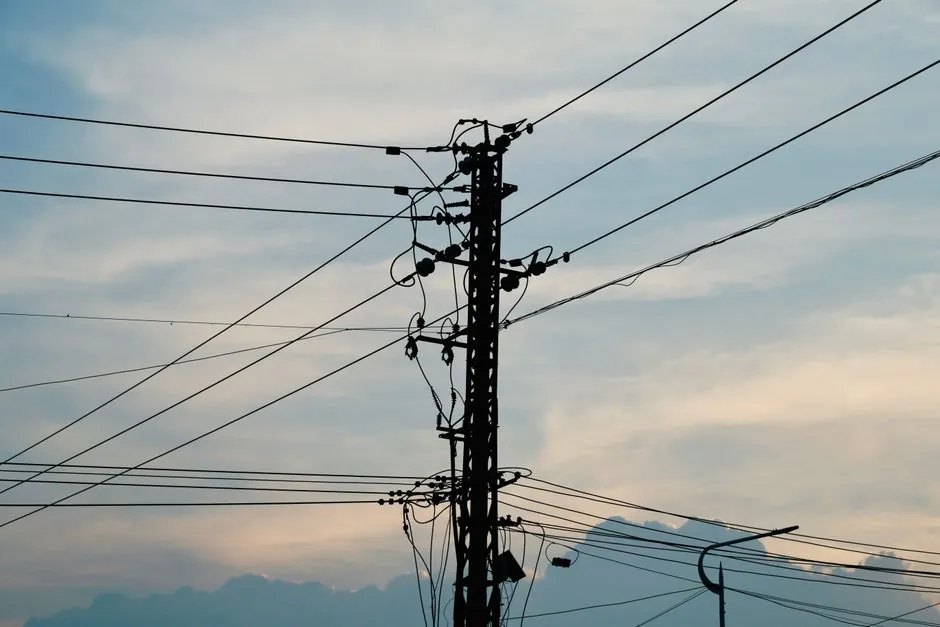
Overhead power cable illustrates a separate constraint: tray fill and NEC derating cap how many circuits can be routed, so a plant that wins on line speed can still lose on capacity if cable construction forces parallel runs that double the meter volume the factory has to ship [S5].
Capacity planning is also constrained upstream by wire rod entry condition, because incoming rod diameter, cast, and surface quality set a ceiling on drawing speed that no MES or ERP standard can override, which is why a real capacity review always starts at rod breakdown, not at the extrusion scheduler [S1].
Trackable signals for the next planning cycle

Two signals are worth watching through the end of 2026: (1) the share of routing standards in cable ERP systems that are auto-recalculated from measured actuals, which is the leading indicator of the 10%–16% income-uplift class of result, and (2) OEE delta between drawing and extrusion lines within the same plant, which exposes where a $246.48 billion market is being constrained at the bottom of the chain rather than the top [S1][S2][S4].
A practical next step for any process engineer is to pick one extrusion line, instrument meters, speed, and energy per meter, classify downtime for four weeks, and compare actual throughput against the routing standard used in ERP promising; the gap, in percent, is the defensible first-year capacity uplift number to put in front of operations leadership [S1][S3].
This topic is covered further in Best Bag Filter for Mining: 2026 Spec Map and Media Selection.