
Conveyor chain pull must cover the material load, chain and carrier weight, track friction, curve resistance, drive losses, and startup conditions, with startup friction commonly 1.5–3.0 times the dynamic coefficient [S1][S2].
The calculation separates sliding and rolling conveyors, distinguishes horizontal, inclined, and vertical routes, and supports direct point-by-point accumulation where curves, inclines, or declines make an average percentage insufficient [S4][S5].
Build the chain-pull force balance
Chain pull is the force needed to maintain normal conveyor speed under load; a complete calculation adds the lift load to resistance generated by chain, attachments, bearings, curves, and the drive unit [S5]. This differs from a simple belt-tension calculation because a chain conveyor may slide, roll, or both, and its friction contribution depends on the track, lubrication, roller construction, and route geometry.
The first calculation phase identifies a provisional chain from the load, conveyor arrangement, chain speed, pitch, attachments, operating conditions, lubrication, and breaking load [S4]. The second phase verifies chain pull, and a final check must confirm that the selected chain and drive withstand the calculated load.
A useful working structure is:
<strong>F_pull = F_lift + F_chain + F_sliding + F_rolling + F_curves + F_drive</strong>
The lift force includes vertical elevation change. For a horizontal run, gravity does not create an elevation-load term, but chain weight, attachments, product weight, and friction still produce resistance. For an incline, the lifted mass contributes its weight component along the route; for a decline, gravity may reduce net drive demand, subject to controls that prevent uncontrolled movement.
Select defensible friction coefficients
John King’s working values are 0.35 for unlubricated chain sliding on a steel track, 0.20 for lubricated chain on a steel track, 0.45 for unlubricated chain on a rough track, and 0.25 for lubricated chain on a rough track [S2].
The same calculation also assigns 0.18 when chain slides on a non-metallic wear strip, typically UHMW, and distinguishes material sliding inside a trough from chain or attachment sliding against the track [S2]. The coefficient must represent the actual pair of surfaces, not simply a generic “friction factor.”
Separate startup and steady-state pull

Startup friction can be 1.5–3.0 times the dynamic friction coefficient, so a steady-state force calculation that omits this margin can underestimate breakaway pull [S2]. A defensible method calculates normal running pull, multiplies each friction-resisting term by 1.5–3.0 as applicable, and then checks the drive, sprockets, couplings, and chain against the higher starting requirement.
John King recommends a roller diameter at least 2.5 times the bush diameter to reduce startup friction [S2]. This geometry does not replace the startup multiplier; it supports roller rotation and limits the tendency for the chain to slide rather than roll. Chain selection also depends on pitch, speed, sprocket tooth count, and load distribution, not on pull alone [S4].
For chain articulation, the pin, bush, and roller create internal friction in addition to external track friction. A conveyor chain therefore develops tension from several resistance sources at once. The engineering guide describes the chain as a sequence of journal-bearing links in which the roller normally turns freely on the bush, while hardened bushes and pins resist wear and maintain gearing action [S3].
Compare sliding and rolling systems
Sliding systems require the largest explicit friction coefficient because chain or attachment movement is directly resisted by the wear strip. Rolling systems distribute motion through rollers and require roller diameter, bush diameter, bearing fit, and track condition to be included in the pull calculation [S2][S4].
Sliding chains fit systems where simplicity and positive drive contact matter, but contamination and poor lubrication raise resistance quickly. Rolling chains suit longer or faster routes where lower moving resistance is valuable, provided roller rotation remains reliable. The cost comparison must include wear strips, lubrication demand, drive sizing, and maintenance rather than purchase price alone.
Accumulate route resistance point by point
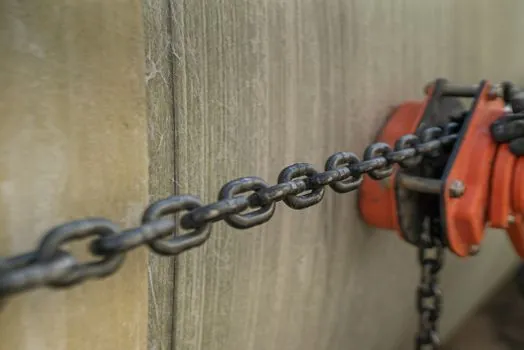
The method is cumulative. Each curve then adds its percentage to the load accumulated from the preceding tangent, so curve location and conveyor direction affect the final drive force.
This percentage method is a system-level estimate for average conveyor conditions. For an abnormally long or complex conveyor, McGinty calls for progressive calculation, accumulating friction through the route rather than applying one flat allowance [S5]. That procedure fits conveyors with multiple curves, mixed elevations, or substantial product drag, where a short cut can conceal a local peak tension.
Apply service, gearing, and operating factors
Chain pull must include a service factor reflecting load variation, starting frequency, environment, and daily operating hours [S2]. John King assigns 1.0 for uniform loading with less than 5% overload, 1.2 for minor variation with 5% to 20% overload, and 1.5 for major variation with 20% to 40% overload. The corresponding factors are 1.0, 1.2, and 1.5 for fewer than five starts per day, five starts per day to two starts per hour, and more than two starts per hour [S2].
Environment multipliers are 1.0 for relatively clean conditions, 1.2 for dusty or dirty service, and 1.5 for humid, very dirty, or corrosive service. Use greater than 10 hours per day adds 1.2, while up to 10 hours uses 1.0. The operating-condition factors are multiplied together, producing a total service coefficient rather than being added [S2].
Gearing adds another adjustment. John King uses 1.05 for sprockets mounted on brass bushes and 1.03 for sprockets mounted on bearings; the chain-pull contribution at each gearing point is multiplied by its applicable factor [S2]. This addresses sprocket or wheel rotation losses that are separate from straight-track friction.
Speed and layout remain independent constraints. APRIL gives 0–30 m/min as the ideal conveyor-chain speed range and 60 m/min as the maximum recommended speed, while warning that low tooth counts and long pitch can increase polygonal surging [S4]. Chain pitch, sprocket teeth, and rotational speed determine whether a calculated pull can be delivered without unstable chain speed.
Check chain capability and failure modes
The calculated pull must be compared with the selected chain’s working capacity and breaking load, and the drive train must also be checked [S4]. A low pull estimate is unsafe when it ignores startup friction, accumulated curve losses, concentrated loading, corrosion, or sticky product contact; an inflated estimate is costly because it can oversize the chain, sprockets, shafts, bearings, gearbox, and drive motor.
Failure modes are identifiable during the calculation. Stick slip can occur on slow conveyors when lubrication floods the track and prevents rollers from turning; uneven loading can aggravate the speed fluctuation [S4]. Hunting or surging can arise from the polygonal effect, cumulative guide contact, long-pitch chain with fewer than eight sprocket teeth, and pitch tolerance on conveyors of 80–100 meters [S4].
The speed, load, and roller chain construction should therefore be reviewed together, not after the pull figure is accepted. The final record should state the friction coefficient for every contact pair, the startup multiplier, service multiplier, gearing multipliers, accumulated route resistance, chain speed, sprocket tooth count, and selected chain rating.
The next trackable engineering check is to recalculate the same route with the lowest defensible dynamic coefficient, the highest credible friction condition, and the 1.5–3.0 startup range; compare the resulting tension band with drive and chain ratings before releasing the chain conveyor design.