
The global cutting tools market sits between USD 23.1 billion and USD 27.7 billion in 2026 across the major sizing houses, with consensus 2026–2035 CAGRs clustering at 4.5% to 5.2% and a Sandvik-led top-five supplier bloc holding 29.5% share in 2025 [S2].
The metal cutting tools market is projected to grow from USD 91.03 billion in 2026 to USD 173.89 billion by 2034, at an 8.40% CAGR [S5]. U.S. factory shipments reinforce the picture: June 2026 cutting tool shipments reached USD 270.5 million, up 31.7% year over year, with USD 1.47 billion year-to-date through June, 19.3% above the same period in 2025 [S3].
Market Size Estimates and the Forecast Spread
Forecasts for the cutting tools market diverge because analysts disagree on scope: some count only consumable cutting tools, others bundle accessories, taps, dies, and measuring attachments. [S1]
Market Research Future sizes the cutting tools market at USD 87,567.3 million in 2025, rising to USD 135,989.4 million by 2035 at a 4.5% CAGR over 2025–2035 [S1]. GMI pegs 2026 at USD 24.5 billion (2025: USD 23.1 billion) with a 5.2% CAGR to USD 38.7 billion in 2035, the most conservative headline number among major houses [S2]. Market Data Forecast puts 2026 at USD 27.73 billion against a 2025 base of USD 26.11 billion, with the market reaching USD 44.87 billion by 2034 [S9]. On the bundled side, The Business Research Company values the combined cutting tool and machine tool accessory market at USD 87.98 billion in 2026, climbing to USD 118.64 billion by 2030 at a 7.8% CAGR [S4]. The practical reading: when someone quotes a "cutting tools market" figure, check whether taps, dies, and accessories are inside, because that single scope decision moves the headline by roughly 3–4×. A 4.5–5.2% CAGR on consumables [S1][S2] sits well below the 7.8% bundled-accessory CAGR [S4] and the 8.40% metal-cutting-tools CAGR [S5], suggesting that the higher-growth pocket is the metalworking carbide and coated-insert segment, not general consumables.
End-Use Mix: Automotive at 33%, Aerospace at 20%
End-use breakdown is the most useful spec for a sourcing decision because the tooling mix changes by application: aluminum and cast-iron drivetrain work calls for different geometries, substrates, and coolant strategies than titanium airframe milling. [S2]
Automotive was the largest end-use in 2025 at USD 7.67 billion, or 33% of cutting tool value, while aerospace and defense contributed USD 4.73 billion, or 20% [S2]. China's electric-vehicle concentration is the single largest demand driver: the country produced more than 70% of global EV output in 2024, roughly 12.4 million vehicles, with Chinese OEMs representing more than 80% of domestic EV production [S2]. That mix favors high-throughput milling, drilling, and deburring of battery enclosures, motor housings, structural castings, and drivetrain components. Smaller but high-value segments covered in MRFR's segmentation include construction, electronics, oil and gas, power generation, woodworking, and die and mold [S1]. The implication for a buyer: if your shop runs automotive work, expect price pressure and catalog breadth to dominate supplier selection; if you run aerospace work, expect application engineering, traceability, and certified substrate lots to dominate.
Tool Type and Material Sub-Segments
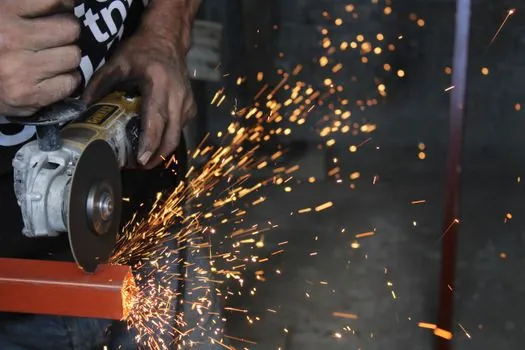
Within metal cutting tools, milling tools held a 28.5% share in 2025, the largest single tool-type bucket, per market.us segmentation of the metal cutting tools market [S8].
MRFR's tool-type split separates indexable inserts from solid round tools, while its material-type split ranks cemented carbide, high-speed steel, ceramics, polycrystalline diamond, and cubic boron nitride [S1]. The high-speed steel cutting tools market is sized at USD 16.21 billion in 2026, growing at a 5.04% CAGR to reach USD 20.73 billion by 2031 [S6]. Note the spread: HSS tools grow slower than the carbide-led metal cutting tools aggregate, which is consistent with carbide and PCD continuing to displace HSS in higher-throughput lines. MRFR also flags digital twins and additive manufacturing customizing tools for specific applications, alongside sub-micron precision tooling for electronics miniaturization and biocompatible diamond coatings for medical implants [S1]. Cutting machines and welding and cutting tool categories overlap with this market at the consumable and accessory boundary, since a saw blade, plasma torch consumable, or a diamond-grinding wheel can be filed under either bucket depending on the catalog.
Regional Split: Asia Pacific Dominates, U.S. Rebounds
Asia Pacific is both the largest and the fastest-growing region in the cutting tool market, while the U.S. is in the middle of a five-year shipment recovery that began in 2021. [S2]
GMI's regional analysis names Asia Pacific as the dominant and fastest-growing region, with the U.S. shipments cycle providing a useful real-time demand signal [S2]. U.S. cutting tool shipments totaled USD 2.56 billion in full-year 2025, up 2.5% from 2024, and December 2025 alone rose 17.1% year over year, the fifth consecutive annual increase [S2]. Industry participants cited aerospace and automotive activity as the supporting drivers and expected a 5–10% improvement in 2026 [S2]. Monthly U.S. shipment data through mid-2026 supports that view: January USD 220.7 million (+9.9% YoY), February USD 225.1 million (+12.8% YoY), March USD 259.3 million (+24.6% YoY), April USD 258.9 million (+21.1% YoY), May USD 239.8 million (+15.2% YoY), June USD 270.5 million (+31.7% YoY) [S3]. Year-to-date through June 2026 reached USD 1.47 billion, 19.3% ahead of the same period in 2025 [S3]. The pattern matters operationally: when a contract manufacturer sees U.S. monthly shipments running 20%+ above prior year for several months, the supporting capacity ramp usually persists 1–2 quarters.
Supplier Landscape: Sandvik, Kennametal, Mitsubishi, Kyocera, Mapal

Sandvik led the cutting tool market with more than 16% share in 2025; the top five players (Sandvik, Kennametal, Mitsubishi Materials, Kyocera Precision Tools, Mapal) collectively held 29.5% share [S2].
MRFR's competing roster includes Robert Bosch, OSG Corporation, ISCAR, MAPAL, Stanley Black & Decker, Klein Tools, ICS Cutting Tools, Snap-on, OTTO BAIER, and Hilti, with a heavier weighting toward portable electric and pneumatic power-tool OEMs rather than dedicated metal-cutting insert suppliers [S1]. GMI's list better reflects the metalworking shop shelf: carbide insert and indexable tool suppliers with application-engineering footprints [S2]. The concentration ratio is moderate: top-5 at 29.5% means roughly 70% of the market is fragmented across regional and specialty producers, which keeps price competition live in commodity HSS and standard insert lines, while application-specific tooling for aerospace, medical, and EV battery work consolidates around the leaders. For a procurement engineer, this dictates a two-track sourcing strategy: qualified catalog suppliers for high-volume consumables, and direct OEM technical engagement for aerospace, medical, and EV-specific tooling. Comparable fragmentation dynamics show up in adjacent industrial consumables, and the abrasives competitive landscape 2026 analysis shows a similar pattern with bonded and coated abrasive makers tracking the same end-use mix.
Technology and Standards Anchors
Cutting tool selection is governed by a relatively small set of accepted substrate and coating standards rather than a single certification regime; the dominant tool material specification references are ISO 513 (classification and application of hard cutting materials), ISO 3685 (tool-life testing with single-point turning tools), and ANSI/ASME B94-style geometry standards for indexable inserts. [S1]
MRFR's segmentation explicitly names carbide, ceramics, PCD, and CBN as the advanced materials enabling high-speed machining with extended tool life, and flags additive-manufactured custom tools as a customization vector [S1]. Sustainability framing in the same source notes biodegradable lubricants and low-emission coatings aligned with net-zero pledges in wind turbine and solar frame machining, plus e-commerce platforms facilitating tool recycling for SMEs [S1]. For a process engineer, the practical anchor is substrate-plus-coating: an ISO 513 classification on the box (e.g., K20 for cast iron, P30 for steel, M20 for stainless) tells you the operating envelope faster than a brand name, and it lets you cross-reference equivalent inserts across Sandvik, Kennametal, Mitsubishi, Kyocera, and Mapal catalogs [S2]. For shops routing work through heavy construction machinery and equipment and riser cutting machine platforms, the relevant tool standard is closer to ISO 3685 tool-life testing and the applicable machine-tool CE/UL electrical safety regime, which are not interchangeable with the metal-cutting insert classifications.
Limitations and Forecast Risks
The market figures are nominal USD and do not adjust for tooling mix shifts toward higher-value carbide and coated inserts, which means real volume growth is lower than the headline CAGR suggests. [S1]
Three caveats matter for procurement. First, scope is inconsistent: the USD 23.1 billion [S2], USD 27.7 billion [S9], and USD 87.98 billion [S4] numbers cannot be directly compared, and the USD 91.03 billion metal cutting tools figure [S5] sits above the consumable-only totals, indicating different category boundaries. Second, U.S. monthly shipment data is a useful real-time signal but is reported with a 1–2 month lag by USCTI and AMT, so it is a confirmation indicator, not a leading one [S3]. Third, automotive and EV demand is highly concentrated in China, where the top-5 OEM share and the 70%+ global EV production share make the market sensitive to any single policy or subsidy change [S2]. Aerospace demand, by contrast, is more diversified and more stable, but with longer qualification cycles for new substrates and coatings. Buyers should therefore weight contracts by end-use exposure: a shop running 60%+ automotive work is exposed to China-cycle risk, while a shop running 60%+ aerospace work is exposed to certification-cycle risk and titanium/composite material price volatility. The adjacent lighting equipment and electric lamps and lamps and light fittings categories sit well outside this market but illustrate how industrial catalog boundaries shift value pools depending on whether a component is sold as a consumable, accessory, or capital good.
Trackable next signals: the July 2026 U.S. cutting tool shipment figure from USCTI/AMT (typically released mid-August), any revision to Sandvik or Kennametal application-engineering capacity in China, and the Q3 2026 update from Market Data Forecast on whether 2026 value tracks toward the lower (USD 24.5 billion) or upper (USD 27.7 billion) end of the consensus band [S2][S3][S9].