
Throughput, first-pass yield, and specific energy consumption (energy per unit) are the three KPIs most commonly credited to digital-twin deployments on discrete and process lines, with baseline-locked measurement over three to six months treated as the minimum defensible methodology [S5].
Where traditional IT ROI assumes a linear hours-saved model, a digital twin distributes value across maintenance, scheduling, throughput, and quality, so a CFO-ready case must define which KPI owns which dollar before the twin is built [S5]. For layout-stage work, see how a digital twin for robot cell layout and reach studies is scored against similar throughput criteria.
Four Quantitative KPIs Standardized for Digital-Twin Performance
Psarommatis and colleagues (2023) propose a procedure for quantitative calculation of digital-twin performance built on four KPIs, intended to replace the current reliance on qualitative claims in industry literature [S3]. The work has been cited 62 times and is one of the few peer-reviewed attempts to define a numeric scoring method for DT effectiveness, applicable across manufacturing cases [S3]. Standardized KPIs of this kind matter because industry reviews have flagged the absence of a single DT-effectiveness indicator as a structural weakness, with ARC Advisory calling out a missing KPI to manage twin maturity in current implementations [S6].
Throughput, Yield, and Energy per Unit: The Operational KPI Triangle
IoT For All's ROI guide groups production yield, energy consumption per unit, and waste generation as the "process efficiency" cluster that captures operational tuning value from a twin, distinct from financial KPIs such as payback period and NPV [S5]. Realistic payback windows for full-scale industrial twins run twelve to twenty-four months; projections under six months typically signal underestimated integration and data-engineering cost [S5]. Cost reduction (measurable drop in an existing expense line) must be kept separate from cost avoidance (an event that did not occur), a distinction the same guide flags as commonly conflated in twin business cases [S5].
Energy-Management Function Inside the Digital Twin
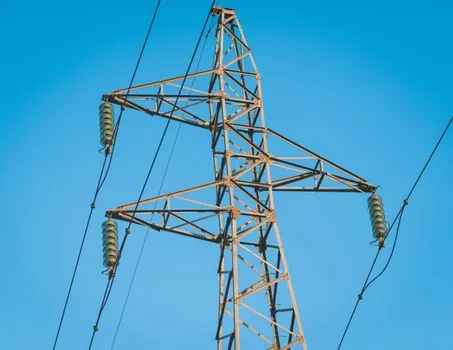
Billey (2023) frames an energy digital twin as a smart-shopfloor tool that reduces energy cost by analysing and optimising load profiles at the unit level, with KPIs tracked against energy management targets rather than aggregate plant bills [S1]. For asset-level rollups, KBC's enhanced unit monitoring paper describes how unit engineers use KPIs to define and measure progress against plant business and strategic goals, with the twin serving as the data spine for the calculation [S2]. A baseline period of three to six months of clean historical data is recommended to strip out normal operational variance before any post-deployment delta is accepted as twin-driven [S5]. The same energy-per-unit logic is what drives a digital twin scheduling for semiconductor fabs tool-level twin versus an operational twin split.
Meteorological and As-Built Data Quality as a Hidden KPI Modifier
Wattch's solar-PV twin work shows that a $4,000 Class A pyranometer installed with poor levelling or non-representative shading will consistently give wrong readings, while a $1,000 Class C unit, properly installed, can deliver enough accuracy for a many-megawatt PV system [S4]. The lesson generalises: digital-twin accuracy is bound by input data quality, and the as-built configuration (array geometry, inverter specs, string wiring) must match what is actually in the field, not what the design drawings show [S4]. Where field changes are small enough to go unreported, only a physics-based twin will flag the discrepancy through string voltages that do not match theoretical calculations, which then becomes a measurable diagnostic KPI in itself [S4].
Comparison: How KPI Choice Shifts by Twin Type
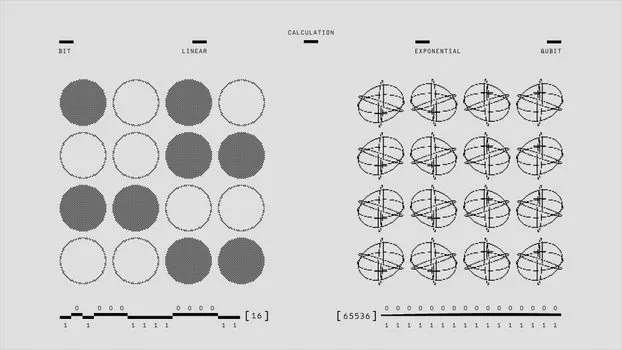
Three common twin archetypes score very differently against throughput, yield, and energy per unit. A production-line twin typically optimises throughput and first-pass yield, with energy per unit as a secondary benefit [S5]. An energy-management twin inverts that priority, putting specific energy consumption and load factor ahead of yield, with throughput treated as a constraint [S1]. A solar-PV fleet twin prioritises performance ratio, soiling loss, and degradation-rate KPIs, with throughput and yield recast as energy yield (kWh per kWp) and availability [S4]. Across all three, baseline capture over three to six months and a defined owner for each KPI are the common requirements before a payback number is presented [S5].
Tooling, Sensors, and Metering That Feed the KPI Calculation
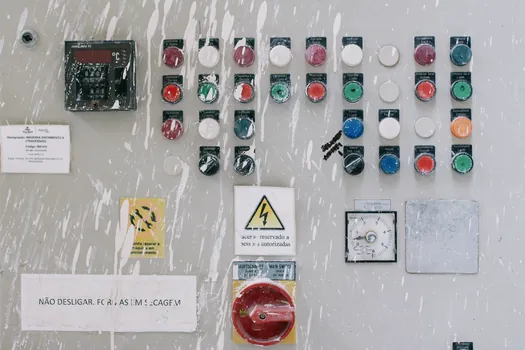
Reliable energy-per-unit and throughput numbers require the same instrument hygiene as any other industrial KPI: clean signals from digital panel meters and digital multimeters at the unit boundary, plus plant-level energy meters tied into a historian at one-second or one-minute resolution. Verification of the physical asset against the as-built model, using checking and testing apparatus during commissioning, is what closes the gap between a digital twin that runs on paper and one that scores against the four-KPI framework [S3]. KPI dashboards, as proposed in the Encyclopedia Pub entry on DT key performance indications, are the practical delivery layer that makes a Measured Value attributable to a named owner rather than a free-floating chart [S9].
Failure Modes and Limits of the Three-KPI Scorecard
The three-KPI scorecard fails when the baseline period is shorter than the natural variance cycle of the line, or when cost avoidance is silently reclassified as cost reduction to inflate ROI [S5]. It also fails when the twin is treated as a generic "visibility" layer instead of a narrow, well-understood business problem, which produces vague numbers that do not survive CFO scrutiny [S5]. The 3e blog on renewable-energy asset twins flags the same misconception set: digital twins in renewables are routinely oversold on availability and performance-ratio gains without a corresponding measurement of forecast error or curtailment loss [S7]. The ASME Twinify ebook similarly aggregates KPIs at region and fleet level, but warns that the same dashboard can hide degradation trends when the sampling cadence is coarser than the failure mode [S8].
Next trackable signals to watch: peer-reviewed adoption of the Psarommatis four-KPI scoring procedure beyond the 2023 paper [S3], and any vendor release that publishes baseline-locked ROI numbers (twelve to twenty-four month payback, three to six month baseline) rather than demo-stage claims [S5].