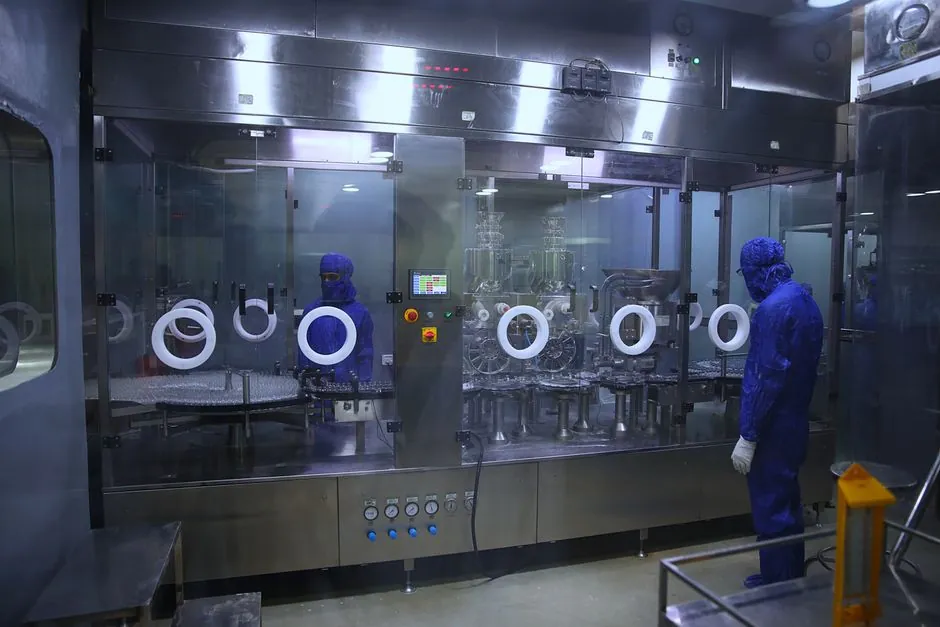
Alkaline (ALK) technology remains the installed-capacity leader at 64% of global capacity in 2025, with PEM holding the remaining share and solid-oxide still in pre-commercial proof cycles [S5].
The 2026 market sizing spread is wide across publishers: Fortune Business Insights pegs the global market at USD 11.28 billion in 2026 [S1], while Future Market Insights puts the 2026 value at USD 1.01 billion with a 24.2% CAGR to USD 8.81 billion by 2036 [S2], and SNS Insider reports a 2026E of USD 3.44 billion and a 87.57% CAGR to USD 1,001.30 billion by 2035 [S3]. Asia Pacific, the only region where all three reports converge on leadership, is valued at USD 2.83 billion in 2026 by Market Data Forecast [S4].
Manufacturer Ranking: Who Actually Sits at the Top of the Capacity Table
Black Ridge Research's capacity-based ranking of the top five global hydrogen electrolyzer manufacturers names LONGi Hydrogen Technology, Plug Power, Hygreen Energy, Bloom Energy, and a fifth position currently in flux as the published list is truncated in the source [S6]. Plug Power's commercial-scale benchmark is the July 2025 commissioning of a 100 MW PEM plant in New York, sized to produce up to 45 tonnes of green hydrogen per day for heavy transport and industrial offtakers [S3].
Asia Pacific supplier concentration is different in shape: LONGi Green Energy Technology, SinoHytec, thyssenkrupp nucera, Siemens Energy, ITM Power, Cummins (Accelera), Plug Power, Ohmium International, and Hyundai Heavy Industries all compete for share in a market where China alone took 58.4% of regional value in 2025 [S4]. The rank above is not a "share" rank; it is a stack-capacity rank, and the two are not interchangeable. Procurement teams comparing bids should always request both a per-MW shipped figure and an installed-base share figure before assigning a supplier a percent of the global market.
Alkaline vs PEM vs SOEC: A Criteria-Based Comparison
Alkaline systems hold 64% of installed capacity and 84% of cumulative deployed units, a function of mature supply chains and lower $/kW for ammonia and refining applications [S5]. In Asia Pacific specifically, alkaline took 68.7% of regional value in 2025, with PEM growing fastest at a 32.4% segment CAGR [S4]. PEM is the technology of choice where the load follows variable renewable input, because the stacks tolerate faster ramp rates and lower minimum loads than alkaline, and that responsiveness is what Plug Power, Nel ASA, ITM Power, and Siemens Energy are scaling for [S3].
On-site installation is forecast to take 58.0% of installation demand in 2026, and high-capacity systems (multi-MW skid builds) lead at 44.0% of the capacity share [S2]. In a side-by-side selection view, the trade space is: alkaline wins on capital cost and stack-life familiarity for steady-load plants, PEM wins on dynamic response for solar/wind-coupled sites, and solid oxide (SOEC) wins on electrical efficiency at high temperature but is not yet at industrial proof stage, which is the explicit reason FMI's analyst commentary flags it as needing longer cycles before wider industrial use [S2]. This selection logic also drives the instrumentation stack and flow-metering choices on the hydrogen side of a green-ammonia plant, where differential-pressure and Coriolis designs see very different duty cycles depending on whether the upstream electrolyzer is alkaline or PEM.
Regional Share: China Dominates APAC, Europe Holds the Largest Single Regional Market
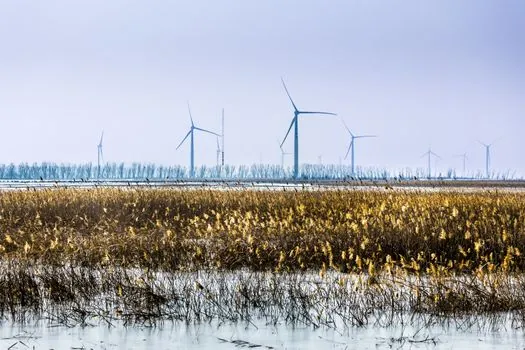
China's share of the Asia Pacific electrolyzer market is reported as 40.6% in one cut and 58.4% in another, the gap reflecting whether the denominator is APAC or APAC plus a global blend, so any cross-source comparison needs to lock the denominator first [S4]. China has committed to 50 GW of installed electrolyzer capacity by 2030 according to IRENA, which is the single largest national procurement target on the public record [S4]. BloombergNEF forecasts Asia Pacific to take nearly 40% of global green hydrogen demand by 2030, and the Hydrogen Council sizes cumulative APAC investment at over USD 100 billion for the same horizon [S4].
Across the rest of the world, Europe is the largest regional market for electrolyzer value in 2026E per SNS Insider's segmentation, with Germany and France driving demand through industrial-decarbonization hydrogen projects, and India sits as the second-fastest-growing country at 23.6% CAGR behind China at 24.8% [S2][S3]. The procurement implication is direct: Chinese OEMs and SinoHytec-class integrators are best-positioned for APAC utility-scale builds, while European buyers of multi-MW alkaline and PEM skids continue to qualify thyssenkrupp nucera, Siemens Energy, Nel ASA, and ITM Power, and US buyers lean toward Plug Power and Cummins Accelera for PEM and Bloom Energy for solid-oxide work [S3][S4][S6].
Where the 2026 Selection Is Actually Headed
Capacity announcements and procurement orders are diverging. Plug Power's 100 MW New York PEM plant is the cited benchmark for commercial-scale PEM in 2025, and the SNS Insider analysis describes ongoing rapid scaling of PEM manufacturing capacity at Nel ASA, ITM Power, and Siemens Energy in response to an accelerating pipeline of utility-scale green-hydrogen project FIDs [S3]. The IEA's Net Zero by 2050 scenario, quoted in the same source, projects hydrogen to supply roughly 10% of global final energy demand by 2050, with green hydrogen from electrolysis taking the dominant share as fossil-hydrogen carbon costs and green-electricity costs converge [S3].
Procurement criteria have hardened through 2025 and into 2026: "Plant owners are looking past installed megawatts and checking uptime risk. Service cover and stack replacement cost carry more weight" is FMI Principal Consultant Nikhil Kaitwade's verbatim framing of the shift from MW-counting to lifecycle-economics screening [S2]. That shift is reinforced by World Bank analysis positioning ALK and PEM as the two commercially dominant technologies and explicitly leaving SOEC outside the "dominant" bracket [S5]. For spec-driven procurement, that means the pressure sensor and control-valve packages now have to be qualified against stack replacement intervals, not just nameplate flow, and the PLC layer has to handle dynamic ramp profiles for PEM-coupled renewables rather than the steady-load profiles most ammonia plants were built around.
Failure Modes and Specification Risks Buyers Should Pre-Load
The dominant risk in 2026 procurement is order-book over-commitment relative to delivered units. Cross-source market sizes disagree by an order of magnitude, USD 1.01 billion (FMI) vs USD 3.44 billion (SNS) vs USD 11.28 billion (Fortune) for 2026, and that gap is not just "methodology"; it reflects different counts of announced capacity, shipped capacity, and revenue-recognized capacity [S1][S2][S3]. A spec writer who assumes the higher figure will over-budget stack-replacement spares and service contracts relative to what is actually running in the field.
Specific technology risks worth pinning in the bid documents: PEM stacks degrade faster under intermittent load, so the warranty wording on cycle count and on-time-between-overhaul is a hard negotiation point for any renewable-coupled site; alkaline systems suffer capacity loss at low-load operation, so minimum-load operating points need to be defined before bid; and SOEC units have not yet accumulated enough operating hours to support full-performance warranties in 2026, which is why most industrial buyers continue to limit SOEC orders to pilot or demonstration projects [S2][S5]. For a deeper look at how 2026 capacity announcements are colliding with project cancellations, see the related writeup on green hydrogen project economics, which covers the same capacity-vs-offtaker gap from the demand side.
Trackable Signals to Watch Through 2026-2027
Three signals will move the manufacturer ranking more than any new product launch: (1) Plug Power's stack-replacement interval disclosures on the 100 MW New York plant, because the operating data there is the de-facto PEM reference for US offtakers; (2) Chinese OEM order disclosures tied to the 50 GW 2030 national target, which will determine whether LONGi and SinoHytec move from capacity-rank to installed-base share; and (3) European FID announcements from thyssenkrupp nucera, Siemens Energy, Nel, and ITM, which are the cleanest read on whether alkaline or PEM wins the next wave of European utility-scale orders [S3][S4][S6]. Each of those signals has a public source, and each will resolve inside a 12-month window from August 2026.