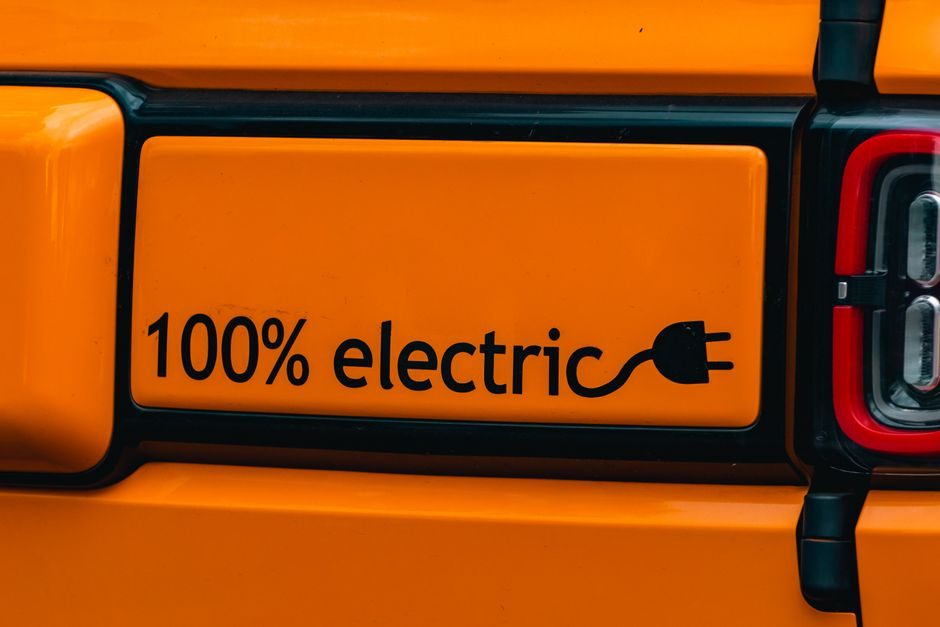
The global EV market was USD 163.01 billion in 2020 and is projected to reach USD 823.75 billion by 2030, a CAGR that has pulled cell pricing from triple-digit USD/kWh territory down into the low-to-mid USD(100s)/kWh range, reshaping which subassemblies actually dominate the cost stack [S5]. The rest of this article walks those drivers from biggest cost line down to smallest, with the volume and chemistry assumptions that move each number.
Battery pack: 30-40% of BOM, the line that moves everything
The lithium-ion traction pack remains the single largest cost line on a modern EV, and every other subassembly is benchmarked against pack $/kWh [S3]. ICCT's 2018 review of life-cycle literature found that battery production was associated with 56 to 494 kg CO2/kWh of capacity, with results varying widely by cathode chemistry, factory energy mix, and cell format — and that 10x range of carbon intensity is a useful proxy for how much chemistry and process choice can move pack cost before you ever turn a wrench on the vehicle [S3].
Pack cost splits into cells, modules/pack housing, BMS hardware, thermal-management components (coolant plates, hoses, chiller), and the high-voltage wiring harness. NMC chemistries carry a higher $/kWh than LFP but a higher energy density at the pack level, so the cost-per-km-of-range is the real figure of merit. Production volume tier is the largest single lever: a sub-50 kWh pack built at <50,000 units/year sits well above the industry average, while a >200,000-unit/year program amortises cell tooling, module fixturing and end-of-line cyclers across enough vehicles to materially compress the cost stack. For a deeper look at the production-equipment side (formation, module assembly, end-of-line), the EV manufacturing equipment spec map walks the cell-to-pack line.
E-drive, inverter and power electronics: 15-20% of BOM
Wide-bandgap SiC devices replace traditional silicon IGBTs in 800V architectures, raising inverter component cost but reducing cooling-system mass and improving efficiency, which shifts dollars between sub-lines rather than purely adding them. [S2]
High-voltage cabling, the DC-DC converter, the PDU (power distribution unit), and the onboard charger each add a smaller but non-trivial slice. Assembly automation level (manual vs. robotic winding of hairpin stators) is the dominant cost lever on the motor side: a fully automated hairpin line has high capex but per-unit cost that drops steeply with volume, while a manually wound line has lower upfront cost but a higher piece-price floor.
Body-in-white, stamping and paint: still 15-20% even when the powertrain is electrified
Electrification does not eliminate stamping, welding and paint — the body-in-white, closures, and paint shop still consume 15-20% of vehicle cost, comparable to an equivalent-segment ICE vehicle. The change is in mix: a multi-material body (steel + aluminium + press-hardened boron) reduces mass to offset battery weight, but the aluminium content raises stamping and joining cost (laser welding, FDS, rivet-bonding) versus an all-steel ICE body. [S2]
Paint shop cost is driven by the number of bodies per hour through pretreatment, e-coat, primer, basecoat and clearcoat, with the sealer and wax-injection stations adding fixed cost regardless of volume. Shared platforms between EV and ICE variants allow factories to ride existing paint shop capacity, which is why several major OEMs have retooled existing assembly plants rather than building greenfield EV-only plants.
Thermal management, chassis and the rest of the vehicle: 20-30% combined
The remaining 20-30% of BOM is a portfolio of smaller but interrelated systems: HVAC and refrigerant loop, brake system (with regen blending logic), suspension, wheels and tyres, interior trim, glass, lighting, software/EE harness, and the ADAS sensor stack (cameras, radar, ultrasonic). Battery thermal management in particular has grown in cost relative to ICE, because EVs need a chilled coolant loop in addition to the cabin HVAC loop, and in cold climates a heat pump plus PTC heater add component cost that an ICE vehicle simply does not have. [S2]
ADAS sensor cost is moving in the opposite direction — solid-state radar and front-camera modules have fallen into a tier where Level 2+ autonomy is no longer a luxury-only feature. For factories specifying component-level test and calibration equipment, the industrial surveillance camera installation acceptance article covers a comparable spec-first acceptance discipline that maps cleanly onto ADAS camera calibration cells.
What is NOT in BOM but still moves the factory's cost: capex, software and warranty
Bill of materials is only one side of EV manufacturing cost. Battery gigafactory capex runs into the billion-USD range per plant, body shops with multi-material joining cells add another major capex line, and paint shop upgrade for aluminium-compatible pretreatment is non-trivial. These costs are recovered through depreciation amortised over plant volume, which is why a 200,000-unit/year program and a 50,000-unit/year program can show the same BOM but materially different per-unit cost. [S3]
Over-the-air software, battery warranty provision, and end-of-life battery take-back are the three "below-the-BOM" lines that have grown in 2026. Battery warranty is typically 8 years / 160,000 km, and the per-vehicle reserve is set against expected cell degradation curves. For a fuller look at how production volume interacts with end-of-life battery returns and charging-network sizing, the EV production capacity planning article lays out the demand-supply balancing problem behind those warranty numbers.
Volume tier and chemistry: the two levers that move every line
Comparing the main cost-driver options against the criteria that actually move a factory's P&L: (1) cell chemistry — LFP delivers lower $/kWh at the cell but lower pack-level energy density, so a long-range BEV pays a pack-cost penalty for choosing LFP; NMC/NCA delivers higher energy density at higher cell cost; sodium-ion is entering the entry-tier segment with further cost reduction but unproven cycle life. (2) Platform architecture — 400V architectures use silicon IGBT inverters at lower component cost; 800V architectures use SiC at higher component cost but enable faster charging and thinner HV cabling, which is a bill-of-materials trade, not a pure cost add. (3) Body mix — all-steel is the cheapest but heaviest; multi-material with aluminium and press-hardened steel raises tooling and joining cost but recovers range; aluminium-intensive bodies sit at the top of the cost curve. (4) Production volume — every subassembly's piece price falls with cumulative volume, but the steepest curve is on cells and e-drive, and the shallowest is on paint and final assembly. [S2]
The decision rule that comes out of these four dimensions: a volume-EV maker at >200,000 units/year with LFP cells, a 400V architecture and a multi-material body lands at the lowest cost-per-km-of-range; a premium-EV maker at 50,000 units/year with NMC cells, an 800V architecture and an aluminium-intensive body accepts a cost-per-km-of-range roughly 1.5-2x higher in exchange for charging-time and range metrics that anchor a higher sticker price. Both factory layouts are defensible — the mistake is mixing a premium cost stack with a volume pricing strategy, or vice versa.
Standards and sourcing signals worth tracking

Battery cell manufacturing sits under UN GTR 20 (electric vehicle safety) and IEC 62660 series for lithium-ion cell performance and reliability, while pack-level safety is increasingly referenced to GB 38031 in China and to ISO 6469-1 in Europe — these are the standards procurement and quality teams should anchor cell and pack sourcing specs against, regardless of chemistry. Battery production emissions reporting is converging on cradle-to-gate LCA per ISO 14040/14044, and the wide 56-494 kg CO2/kWh range reported in the ICCT literature is the bound that LCA-aware sourcing decisions are made within [S3].
For sourcing teams comparing pack and component quotes, track two trackable signals over the next two quarters: (1) reported LFP cell $/kWh trajectory — whether it holds below the 2025 average or compresses further as more LFP capacity comes online; (2) SiC inverter die pricing — whether 800V architecture cost premium narrows enough to pull mainstream 400V platforms up to 800V in the next refresh cycle. Both signals are visible in OEM earnings disclosures and tier-1 inverter supplier guidance, both move the cost stack laid out above, and both are the levers that will determine whether the next generation of EVs lands closer to ICE parity on a like-for-like trim basis.
For the relevant spec sheets and selection criteria, see additive manufacturing material, agv robot, and electric actuator.