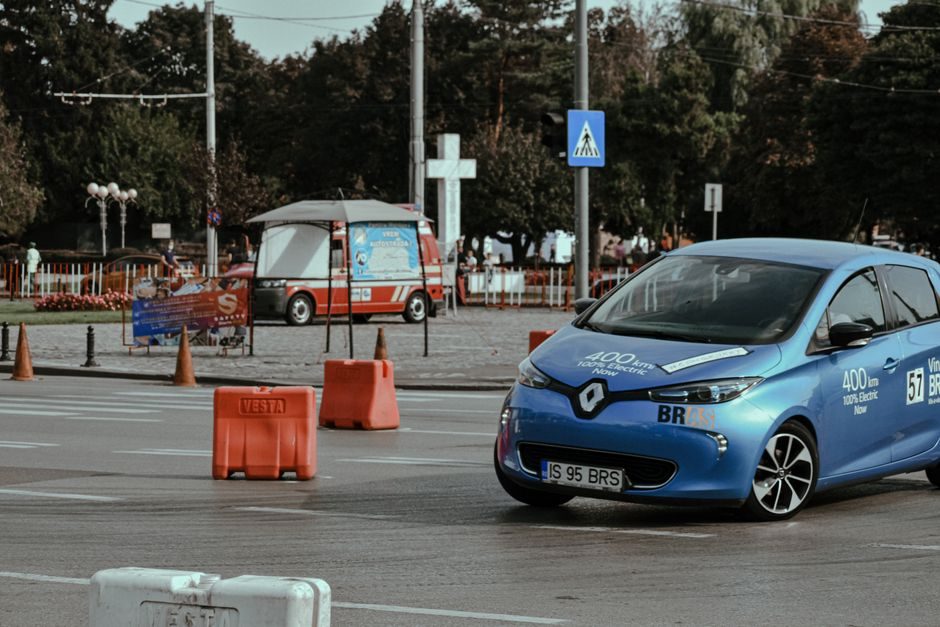
EV production capacity planning is not a single number but a three-way coupling: new-vehicle demand, end-of-life (EoL) battery return volumes, and charging-infrastructure throughput, each with a planning horizon measured in years and a forecast error that compounds [S1].
For a new EV programme, long-term forecasts answer two distinct questions: how fast remanufacturing technology must mature, and how much physical capacity (lines, cells, disassembly cells, charge points) must be stood up and in what year [S1]. Treating these as one forecast is the most common planning failure.
Why Standard Sales Forecasting Fails for EV Capacity
Classic long-term capacity planning borrows forecast methods from supply chain management, but those methods are "mainly intended for new product sales and established products" and do not account for end-of-life uncertainties that dominate EV battery flows [S1].
Three EoL-specific uncertainty sources distort any EV capacity number: core availability (how many retired packs come back), core quality (state-of-health, chemistry mix), and collection-procedure economics [S1]. For an established ICE programme, none of these appear in the demand forecast; for an EV battery remanufacturing line, they are the demand forecast.
The Three Forecast Lanes and Their Decision Horizons
Lane 1 — new-vehicle demand: driven by macro EV adoption curves, battery cost per kWh, and incentive policy. Capacity sizing here uses 5-10 year sales scenarios and is sensitive to platform-sharing assumptions (shared cells across multiple nameplates amortise line capex but couple forecasts). [S1]
Lane 2 — EoL battery return: EoL volumes of new EV products are "highly important" but "challenging and afflicted with various sources of uncertainty," because the vehicle parc that will eventually return hasn't been sold yet when the line is being designed [S1]. Material-flow and stock-driven models are the main methods cited for this lane [S1].
Lane 3 — charging-station capacity: this is a different problem class, solved as a joint power-and-transportation-network optimisation rather than a manufacturing line problem, with traffic data benchmarking EV behaviour and load-capability constraints integrated into the planning model [S3].
Remanufacturing Capacity vs. New-Build Capacity: A Criteria Comparison

The two capacity decisions diverge on every practical criterion, which is why they must be planned separately even though they share the same battery. [S1]
Decision criterion — forecast driver: new-build lines track new-vehicle sales; remanufacturing lines track EoL returns, which lag first-life sales by 8-15 years depending on vehicle duty cycle [S1].
Decision criterion — lead time: new gigafactory lines need 18-36 months from groundbreaking to first pack; remanufacturing disassembly cells can be stood up in 6-12 months because the throughput per cell is lower and the equipment set is smaller.
Decision criterion — risk profile: new-build overcapacity writes off depreciated capex; remanufacturing undercapacity writes off recoverable material value and can flood EoL packs into second-life or recycling channels at sub-economic pricing.
Decision criterion — automation fit: "growing efforts to automate remanufacturing operations or at least parts of it, like disassembly" make reman capacity a moving target where the line you build this year may not match the automation economics of year three [S1].
Charging-Station Capacity Planning: A Network, Not a Line
EV charging station planning is explicitly a "model, algorithm, simulation, location, and capacity planning" problem, treated as a coupled infrastructure question rather than a manufacturing-throughput question, with the "global adoption of EVs" curtailed by "nascent battery technology" and the corresponding infrastructure gap [S2].
For industrial specifiers, the practical implication is that production capacity sizing and charging-network sizing must reconcile on three shared numbers: peak kW draw at the plant gate, fleet duty cycle (km/day, dwell time), and the mix of AC versus DC fast charging, all of which feed back into the upstream battery and pack forecasts [S2]. A line sized for 50 GWh/year that the local grid cannot charge at the corresponding peak rate is a stranded asset.
Failure Modes and Constraints That Routinely Break the Plan
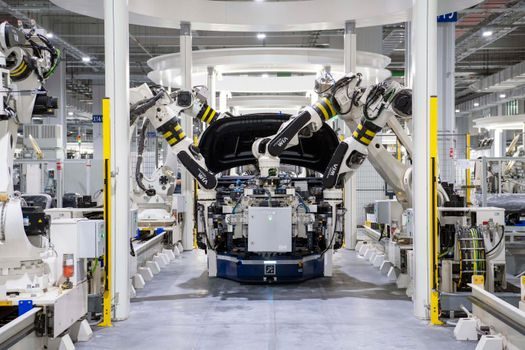
Forecast-method failure: applying new-product sales techniques to EoL flows "does not account for the additional uncertainties when dealing with End-of-Life products," so a forecast that looks tight in the sales-and-operations meeting is structurally optimistic on the reman side [S1].
Material-flow failure: a forecasting approach that ignores geographic concentration of EoL returns will mis-size regional disassembly capacity. Spatial analysis of EoL flows inside large EV markets is treated as a separate sub-problem in the literature, not a free input [S1].
Infrastructure coupling failure: charging-station planning that ignores traffic constraints produces stations in the wrong cells of the road network, which then underutilises the upstream battery production because the fleet cannot operate at its design duty cycle [S3]. The traffic and load-capability constraints have to be integrated into the model from the start, not bolted on after siting [S3].
Standards and Sourcing Anchors for the Spec Sheet
No single IEC or ISO standard governs EV production capacity sizing; the planning literature explicitly couples material-flow analysis, long-term capacity management, and stock-and-flows models rather than a regulated load-case [S1]. For the battery and pack themselves, specifiers should anchor on the cell-format and line-sizing decisions documented in adjacent cell-and-pack reference material, where line throughput is matched to cell-format mix rather than to a nameplate GWh figure alone [S1].
For the industrial control and instrumentation that sits around any EV or battery line — cell-format detection, electrolyte handling, formation cycling, and end-of-line test — the electric actuator and flow-meter classes on the spec sheet carry the same 3-7 year lifecycle as the line itself, and are routinely the first place a capacity plan slips on delivery.
For the charging-network side, pressure transmitter and flow-meter selection at the dispenser skid is driven by the same peak-kW reconciliation that drives upstream cell-line sizing, so a capacity plan that locks the cell format before the dispenser instrument tree is locked tends to re-spec the dispenser skid at commissioning.
Trackable next signal: any new gigafactory press release that states a named cell-format mix and a GWh/year number, cross-checked against the regional EoL return curve from material-flow analysis, is the single most reliable indicator of whether a programme's Lane 1 and Lane 2 forecasts have been reconciled. A second signal: utility-side interconnection queue data for the substation feeding the plant, which exposes Lane 3 (charging-network) assumptions on the same timeline the cell line is ordered.
For related coverage, see High-Pressure Gas Line Hydraulic Valve RFQ: The Five Lines That Lock the Quote.