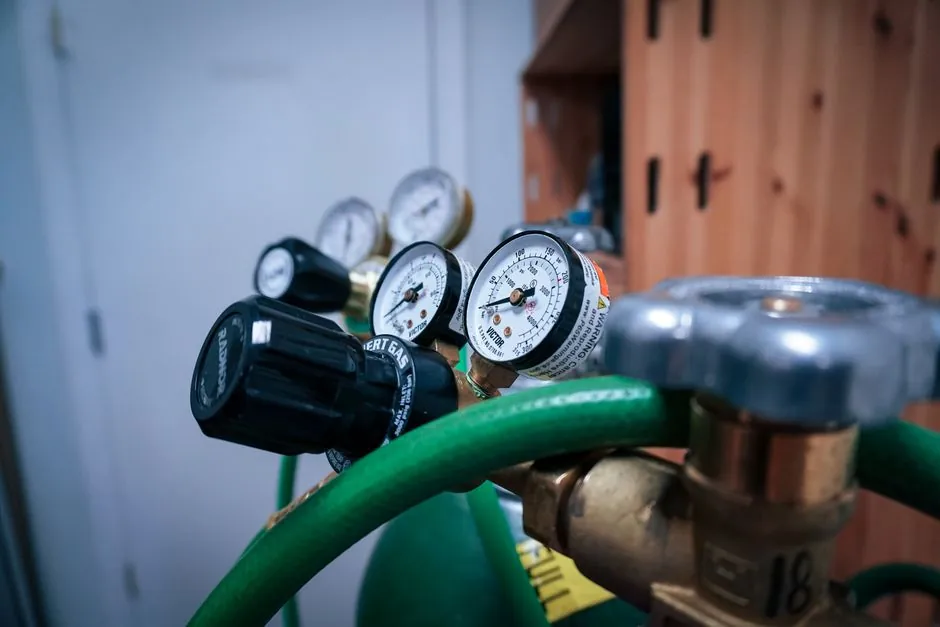
In PEM and AEM electrolyzers, the hydrogen-side flow and pressure control loop is the single largest determinant of membrane life, stack uptime, and the final LCOH figure, which optimised hybrid renewable-hydrogen systems put at $3.30 to $3.85/kg in a 2026 multi-author review [S2]. Differential pressure between anode and cathode must typically be held within a ±20 to 50 mbar window to avoid membrane deflection, fatigue cracking and eventual pinhole failure [S1].
Green hydrogen is hydrogen produced by splitting deionised water with renewable electricity, mainly through alkaline (AWE), proton exchange membrane (PEM), or anion exchange membrane (AEM) electrolysis [S4]. Global installed electrolysis capacity exceeded 4 GW in 2025 and roughly doubled year on year, per IEA figures cited in industry training material [S4], which is why instrumentation choices made on pilot stacks are now propagating directly into gigawatt-class designs.
What flow and pressure control actually has to do inside an electrolyzer
Water feed control is the first control function, and the feed water must typically meet a conductivity specification below 1 µS/cm to protect membrane ionomer chemistry [S1]. Magnetic flowmeters or thermal mass flow controllers provide the continuous signal used to modulate a feed control valve, with conductivity and pH sensors integrated into the same loop so the control system sees reactant quality, not just quantity [S1].
Differential pressure management between anode and cathode is the most demanding loop because PEM and AEM membranes are mechanically fragile. Two back pressure regulators on the hydrogen and oxygen outlet lines work in tandem with a differential pressure controller, and the regulator response time has to be fast enough to absorb second-scale renewable load swings without breaching the ±20 to 50 mbar window that the membrane can tolerate [S1]. Failure modes are concrete: sustained over-pressure differential causes membrane deflection, fatigue cracking, and pinhole formation, each of which is a stack-replacement event rather than a field repair.
Why hydrogen is a hostile fluid for ordinary instrumentation
Hydrogen's small molecular size promotes leak paths through gasket materials and into metallurgical microstructures, and its wide flammability range in air drives the need for certified purge and vent design on every instrument enclosure. PEM and AEM electrolysis show the highest compatibility with variable renewable sources of the three mainstream electrolyzer technologies because of their rapid dynamic response, but material durability under cyclic pressure remains a stated challenge in the 2026 review literature [S2].
Process gas-side measurement has to deal with two-phase flow because both product streams carry entrained water vapour and liquid water out of the electrochemical stage, and gas-liquid separation plus drying stages downstream are where most field instruments actually live. For oxygen service, materials selection has to avoid ignition-promoting combinations, which is why many electrolyzer OEMs restrict wetted elastomers and lubricants on the O2 side rather than reusing standard pneumatic instrument specifications.
DCS, digital twin, and predictive analytics: the new control envelope
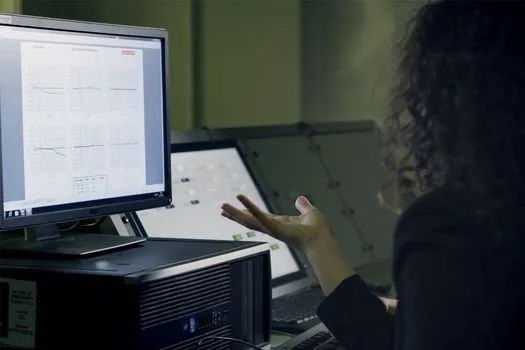
A distributed control system that integrates instrumentation with predictive data analytics lets operators track pressure, temperature and flow continuously while a digital twin simulates how the stack will respond to load changes before they happen [S3]. Field applications of this predictive optimisation approach have shown energy-cost reductions of up to 20%, a margin that flows directly into LCOH [S3].
Electricity cost is roughly 70% of green-hydrogen production cost, which is why predictive scheduling of when to run the electrolyzer, when to store energy, and when to throttle load has a bigger economic impact than incremental efficiency gains inside the stack [S3]. On the renewable-hybrid side, grid-forming control strategies have been reported to cut energy losses by 34.27% and storage demand by 67% in a 2026 review, complementing the electrolyzer-side control loop rather than replacing it [S2]. The instrumentation foundation therefore has to be designed for fast, deterministic data delivery into the DCS layer, not just for local indication.
Decision criteria: which control architecture fits which electrolyzer
For AWE plants, the dominant flow-control pain point is the recirculating KOH/NaOH electrolyte loop, where magnetic flowmeters and corrosion-resistant control valves are the workhorse, and differential pressure control is far looser than PEM because the diaphragm is mechanically more tolerant. For PEM plants, the tight ±20 to 50 mbar differential pressure window, the sub-1 µS/cm feed-water conductivity target, and second-scale load following push the spec toward fast mass flow controllers, high-resolution differential pressure transmitters, and tight valve authority [S1][S2].
For AEM plants, the control architecture resembles PEM at the gas side but with different wetted materials, and dynamic response remains a strength versus AWE, which makes AEM attractive for variable renewable input [S2]. Across all three architectures, the side-by-side trade-off looks like this on four decision criteria: (1) differential pressure tolerance, AWE looser than PEM roughly an order of magnitude; (2) feed-water purity requirement, all three below 1 µS/cm; (3) dynamic response to renewable load swings, AEM and PEM faster than AWE; (4) cost of the control and instrumentation package per MW of stack, AWE lowest, PEM highest, with AEM falling between as commercial scale-up continues [S1][S2].
Standards, safety, and what to verify before signing the P&ID

Hydrogen service pushes instrument selection into ATEX/IECEx-classified equipment for the European market and NEC Class I Division 1 or 2 wiring in North America, with the exact zoning driven by vent and leak-rate calculations that the EPC has to defend in the safety case. On the process side, wetted material selection in oxygen service has to follow recognised cleanliness protocols to keep ignition energy low, and differential pressure transmitters need a range and turndown sized to the ±20 to 50 mbar PEM operating window rather than a generic 0 to 10 bar industrial range [S1].
On the digital layer, buyers should verify that the DCS supports the I/O density and update rate the digital twin needs, because instrumentation upgrade decisions made now will determine whether the plant can adopt the predictive optimisation that delivers the 20% energy-cost reduction in the field data [S3]. For projects in the LCOH $3.30 to $3.85/kg range reported for optimised hybrid systems, the control and instrumentation package is the variable that separates the top quartile of plant economics from the median [S2]. Buyers looking to spec the actual flow element hardware can benchmark suppliers against the Coriolis flowmeter suppliers: 2026 brand, spec, and size coverage map, since Coriolis meters are increasingly specified for high-purity water feed and hydrogen product streams on PEM builds.
Who this instrumentation spec is for, and where it does not fit
This spec envelope is for engineering procurement and construction contractors sizing PEM or AEM electrolyzer skids above 1 MW, for OEMs integrating the BoP (balance of plant) around a licensed stack, and for owner-operators preparing tender documents for gigawatt-scale projects where control performance drives bankability. It is not a fit for grey or blue hydrogen plants using steam methane reforming, where the instrumentation envelope is set by fired-heater combustion and high-temperature shift converter metallurgy, not by membrane differential pressure control. [S1]
It is also a poor fit for very small demonstration units below roughly 100 kW, where the cost of full DCS redundancy and Ex-rated instruments cannot be amortised and a simpler PLC plus local indicator architecture is usually correct. For the broader process-control background that an instrumentation engineer needs when moving from hydrogen into adjacent process plants, the process control reference covers the generic control-loop theory, and the process calibration page covers the field discipline needed to keep the ±20 to 50 mbar window honest over a multi-year operating cycle.
Track next: (1) whether the IEA's 2026 Global Hydrogen Review raises the >4 GW electrolysis base case installed at end-2025, and (2) whether any of the major electrolyzer OEMs publishes a quantified field dataset on differential pressure excursion frequency versus membrane replacement intervals, which would let buyers turn the ±20 to 50 mbar window into a measurable MTBF input. For engineers also specifying the downstream Fuel Cell Stack Production Line Design: Specs, Stack Formats, Automation Levels, the instrumentation choices on the electrolyzer side set the gas quality envelope that the fuel cell line must accept.
For component-level specifications, see construction machinery and equipment.