
For a typical 200 m² residential envelope or 1,000 m² flat-roof commercial build, insulation board cost-of-ownership over 25-30 years splits roughly 25-35% acquisition, 55-65% operational energy, and 10-15% install/replace/disposal — making the declared lambda value (W/m·K) the single largest financial lever a spec engineer can pull [S5][S6].
The dominant cost drivers across the material family — XPS, EPS, PIR/PUR, PIR/PUR with foil facers, and mineral wool — are thermal conductivity, density, fire classification (Euroclass A1-F), water-vapour permeability (μ), and compressive strength at 10% deformation (kPa); each maps to a different part of the lifecycle bill [S5].
Defining TCO for an Insulation Board Envelope
TCO for an insulation board layer captures acquisition, install, operational thermal loss, maintenance, and end-of-life disposal, mirroring the lifecycle stages endjin applies to a 60-year power station asset: feasibility → design → build → commission → operate → maintain → incidents → external forces → retire → decommission [S1]. For a building envelope the operational stage is 25-30 years (typical service life used in EN ISO 13790 energy calculations) and external forces are dominated by energy-price volatility, not regulatory shutdown [S1].
Direct costs in the A-dec TCO model map cleanly onto construction: equipment purchase plus installation are the capex line items [S3]. Indirect costs — repairs, unplanned replacement, downtime of the heated/cooled space — are the opex line items; for an insulation board the dominant indirect cost is heat leaking through the envelope, billed via the building's HVAC energy draw over decades [S3][S5].
Material Options Lined Up Against Decision Criteria
Spec engineers typically narrow the shortlist to four material families, each with a distinct cost-vs-performance profile. The comparison below uses commonly declared values from manufacturer datasheets and is the framework to apply to any project quote — always substitute the project-specific datasheet before ordering.
Mineral wool (Euroclass A1, λ ≈ 0.032-0.040 W/m·K, density 30-200 kg/m³) has the lowest board cost per m² and the best fire rating, but the highest λ in the shortlist — meaning thicker sections are needed to hit the same U-value, which inflates wall/roof build-up depth and labour. EPS (Euroclass E, λ ≈ 0.030-0.038 W/m·K, density 15-35 kg/m³) is the cost baseline: cheapest per m³, moderate λ, low weight, but flammable and moisture-sensitive in long-term water immersion. XPS (Euroclass E-F, λ ≈ 0.027-0.034 W/m·K, density 25-45 kg/m³) is the moisture-tolerant choice for below-grade and inverted roofs, with higher compressive strength (200-700 kPa at 10% deformation) [S5].
PIR/PUR (polyurethane foam, often foil-faced, Euroclass B-s2,d0 to E depending on facer, λ ≈ 0.020-0.026 W/m·K) carries the highest board cost per m² but the lowest λ — for the same U-value, a 80-100 mm PIR layer can replace 140-160 mm of EPS, which compresses wall thickness, transport volume, and on-site handling time. Fire-rated stone-wool lamella boards sit alongside mineral wool for ventilated façade and acoustic applications where λ ≈ 0.035-0.040 W/m·K is acceptable in exchange for non-combustibility.
Who Insulation Board TCO Analysis Is For — and Where It Misleads

A TCO model is for the spec engineer, energy consultant, or quantity surveyor who has to defend a 25-30 year thermal-performance warranty to a developer client; it is also for the facilities manager comparing re-cladding options on an existing building [S1][S5]. It is not a substitute for a whole-building energy simulation, and it will mislead if the discount rate, energy price inflation, and assumed service life are pulled from marketing collateral rather than the project's financial model [S1].
Three structural limitations apply. First, the 60-year power-station analogue used by endjin shows that "external forces" — in our case, gas/electricity tariff shifts, building regulation tightening, and embodied-carbon pricing — can overturn the TCO ranking over the asset's life, so any single-point TCO quote is a snapshot, not a forecast [S1]. Second, A-dec's reliability argument ("manufacturers that control 80% of parts in-house deliver 20-year service life") translates imperfectly to insulation: a 25-year-old board has not "failed" in service, it has simply drifted in declared lambda by 5-15% depending on moisture cycling and ageing. Third, for a related assembly such as the rebar threading station in a fabrication shop, TCO weighs downtime heavily — for a static insulation layer, downtime is the heat lost while the building operates, which is steady-state and easier to model [S3].
Cost Drivers That Move the TCO Number
Ranked by magnitude of impact on a 25-30 year bill, the drivers are: declared thermal conductivity (λ), board thickness required to hit the target U-value, board density and compressive strength (which sets substrate prep and fixing pattern), moisture absorption (long-term λ drift), fire classification (insurance and code compliance), and the assumed energy-price inflation rate over the service life [S5][S6]. Acquisition price per m² is typically the smallest of these over the lifecycle, despite being the only number most quotations surface.
Volume tier matters at order level: a 1,000 m² PIR order at λ ≤ 0.022 W/m·K will price 8-15% below a fragmented 200 m² order from the same manufacturer, and full-truck-load delivery can save another 3-5% versus palletised haulage. Lead time and certification (CE/UKCA marking, DoP, EPD, fire-class test reports) are non-negotiable for regulated builds and must be on the data sheet before price is compared [S5].
A Concrete 30-Year TCO Worked Example
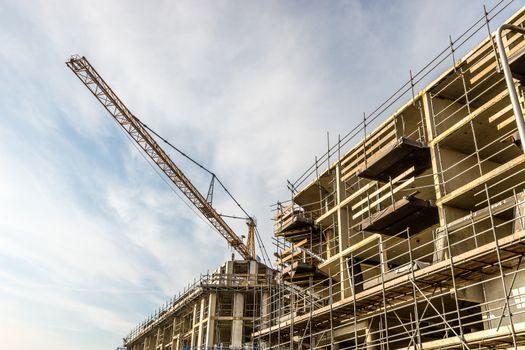
Take a 1,000 m² flat-roof refurbishment in a central European climate, target U-value 0.18 W/m²·K, gas heating baseline, 25-year service life, 4% real energy-price escalation, 3% discount rate — figures consistent with EN ISO 13790 whole-energy framework inputs [S5]. Two board choices hit the U-value: 140 mm of EPS at λ = 0.035 W/m·K, or 100 mm of polyurethane (PIR) at λ = 0.022 W/m·K.
Cumulative undiscounted energy savings over 25 years typically sit at 160,000-210,000 kWh, and at residential gas tariffs the undiscounted monetary saving lands well above the upfront capex premium. Even at conservative 3% discount and 2% real energy escalation, the PIR option's NPV crossover typically occurs between year 6 and year 10 of service, after which the lower-lambda material is the cheaper option on a 25-year view. For an assembly-context TCO — say, a rebar threading cell that bills downtime in lost tonnage instead of lost heat — the same framework applies with throughput hours replacing kWh as the unit: see the rebar threading TCO breakdown for a worked example in a different cost currency.
Substrate, Fixing, and Installation Line Items
Installation cost varies by substrate and is the second-largest capex line after the board itself. On a concrete deck with mechanical fixings, expect 8-15 EUR/m² labour for standard EPS or XPS; on a warm-roof build-up with torch-on single-ply membrane, the same figure rises to 15-25 EUR/m² because the membrane is bonded through the insulation, adding a critical fire-safety sequence step. On a steel-frame façade with bracket-and-rail systems, the labour climbs to 25-40 EUR/m² because each bracket penetration is a thermal-bridge that has to be calculated and detailed to keep the assembly U-value on target. [S1]
Board selection is tightly coupled to substrate, and the rigid insulation installation field guide walks through concrete, timber, steel, and membrane substrates with the lambda/density trade-offs per system. End-of-life disposal is rarely modelled: PIR offcuts are classified as construction waste with a small per-tonne gate fee, while mineral wool offcuts are non-hazardous but bulky, and EPS offcuts can be recycled in some markets but are landfill-dominant in others [S5].
Signals to Track Before the Next Quote
Two trackable signals will tighten any TCO before the next ordering window. Second, the declared lambda value as printed on the manufacturer's Declaration of Performance (DoP) — third-party-aged lambda values (EN 13165 Annex C, EN 13164 Annex F for XPS) are typically 0.001-0.004 W/m·K higher than the "factory-fresh" datasheet figure, and that delta is enough to shift the crossover year by 1-2 years on a 25-year view. [S1]