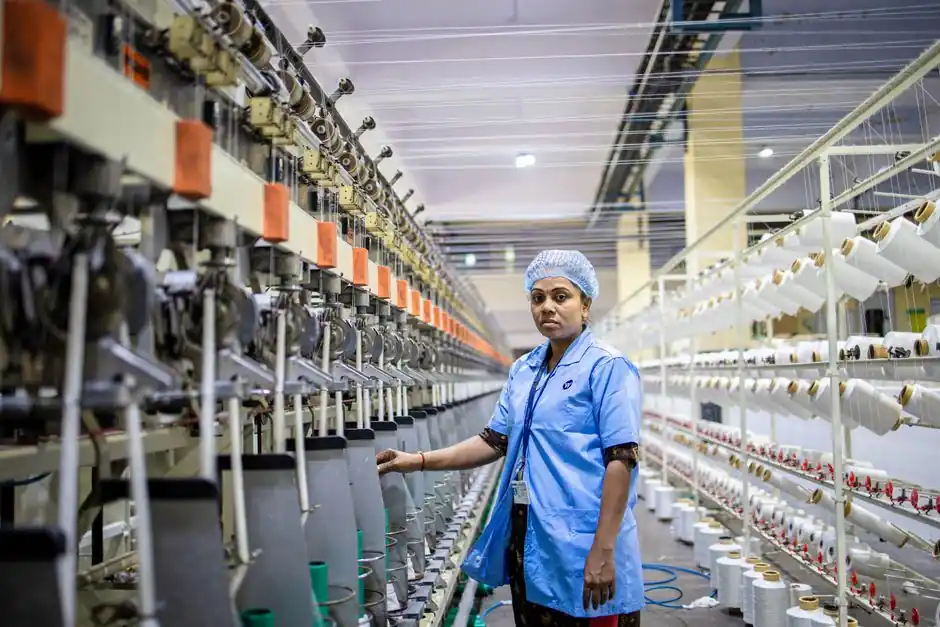
For a five-station line with station OEE values of 82%, 78%, 85%, 71%, and 88%, the simple average is 80.8%, but that figure does not represent constrained line throughput [S5].
Machine OEE diagnoses availability, performance, and quality at individual assets, while line OEE evaluates the sequential line against its bottleneck and theoretical maximum output [S1][S5].
What Line OEE and Machine OEE Measure
OEE is calculated as Availability × Performance × Quality. Availability compares run time with planned production time, Performance compares ideal cycle time with actual output rate, and Quality divides good count by total count [S2][S4].
Machine OEE applies those factors to one asset. Its simplified calculation is Good Count × Ideal Cycle Time ÷ Planned Production Time, subject to the defined time boundaries and product-specific cycle assumptions [S2].
Line OEE, also described as Overall Line Efficiency, extends asset-level loss analysis to a connected production system rather than treating each station as an independent producer [S1]. On a sequential line, the station with the lowest throughput capacity constrains the output that the complete line can realize [S5].
Aggregation Methods Compared
Simple averaging, volume weighting, and constraint-based calculation answer different questions. The choice depends on whether the assets are independent, whether volume differs between lines, or whether sequential bottleneck behavior governs output [S5].
For five stations reporting 82%, 78%, 85%, 71%, and 88% OEE, the arithmetic mean is 80.8%. This method is meaningful for independent assets, but it is misleading for sequential stations because the line's actual output is constrained by its slowest station [S5].
Weighted averaging uses each machine’s OEE multiplied by its production-volume contribution, divided by total production volume.
Constraint-based line OEE compares actual line output with the theoretical maximum set by the bottleneck. It is the defensible method when the engineering question is “How much of the line’s designed output was delivered?” [S5].
Why Station Averages Mislead

Five stations at 85% OEE do not establish 85% line OEE when one station is the bottleneck. The other stations can improve their utilization while the line continues to produce at the rate permitted by the bottleneck [S5].
Machine OEE remains necessary for improvement work because it identifies where each station loses availability, speed, or quality. The component values expose breakdowns, changeovers, setups, material shortages, slow cycles, minor stops, scrap, and rework [S2][S4].
A line score cannot replace that diagnosis. If a downstream station creates rework or rejects components, upstream station OEE can look acceptable while the line loses saleable output. In a multi-station system, retain the three OEE factors for every station, then calculate the line result from good completed output, planned line time, and the applicable bottleneck capacity [S1][S5].
Multi-Station Lines and Product Mix
Discrete manufacturing complicates OEE because lines produce countable products, undergo frequent changeovers, and can have different ideal cycle times for each part number. A CNC machine running 50 part numbers cannot use one ideal cycle time for every product without making its Performance result meaningless [S2].
The common 85% OEE benchmark is a rule of thumb rather than a universal acceptance limit. Targets should be set by asset, shift, and product mix; a benchmark applied to a high-mix line can conceal product-specific losses [S4].
First-piece inspection after a changeover may create expected rejects that should be recorded separately from ordinary production quality losses [S2]. For each product, the calculation needs Planned Busy Time, Actual Production Time, Planned Run Time per Item, Produced Quantity, and Good Quantity, using consistent definitions across sites [S4].
Recommended Measurement Structure
Use a two-level scorecard: machine OEE for station management and constraint-based line OEE for system performance. Calculate machine OEE with Availability × Performance × Quality, preserving the underlying losses instead of publishing only one percentage [S2][S4].
Use simple averaging only for independent assets that do not constrain one another. Use volume-weighted averaging for a facility containing multiple lines with different production volumes, but do not call that result sequential line OEE [S5].
For the connected line, identify the bottleneck from demonstrated capacity rather than the lowest OEE percentage alone, then compare actual good output with the maximum output permitted by that constraint over the same planned period [S5].
Limits, Failure Modes, and Data Requirements
Machine and line scores must use the same defined production window, or the comparison is invalid. [S5]
A second failure mode is applying one ideal cycle time to products with different cycle requirements. A third is treating planned changeovers, setups, and material shortages as if they were performance losses rather than availability losses [S2].
OEE is tied to ISO 22400-2 terminology and calculation practice, while OPC Foundation terminology includes PBT, APT, PRI, PQ, and GQ [S4]. Machine OEE supports asset-level early warning of rising stops, gradual performance decline, and late scrap detection, but line OEE remains necessary to determine whether those losses affected saleable throughput [S4].
The practical acceptance rule is simple: publish station OEE for improvement ownership, publish constraint-based line OEE for plant performance, and prevent simple averages from entering line scorecards. Validate product-specific cycle times and planned-time boundaries before comparing shifts or product families [S1][S2][S5].