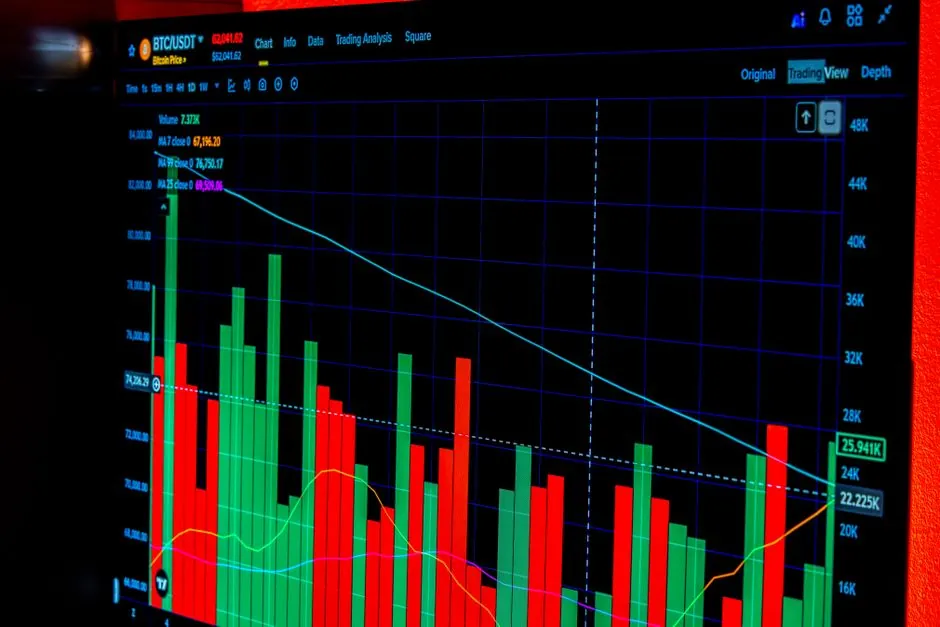
Line balancing redistributes task elements across workstations so each station's cycle time sits as close to takt time as possible, and 85% to 95% line-balancing efficiency is considered strong for assembly work.
The method applies to production or assembly lines and distributes work elements across stations or cells so each station's cycle time sits as close as possible to takt time.
What Line Balancing Controls with Real-Time Data
Line balancing distributes timed work elements across a sequence of stations so each station cycle time fits within takt time while idle time and queues are reduced [S1][S7]. Takt time equals available production time divided by customer demand; for example, producing 400 units within a 480-minute shift gives a takt time of 1.2 minutes per unit.
A station above takt is a bottleneck, while a station below takt has spare capacity [S2][S3]. The controlling equation is balance efficiency = sum of all task times divided by station count multiplied by bottleneck cycle time, multiplied by 100 [S1]. A perfectly balanced line has a cycle time equal to takt time, and 85% to 95% line-balancing efficiency is considered strong for assembly work.
Real-time operation data closes the measurement loop that a spreadsheet cannot. Connected equipment can calculate cycle time, identify stations above takt, expose excess capacity, and display line-level OEE for prioritizing improvement work [S3]. For instrumentation, a data logger can preserve timestamped production events for task-level analysis, while a digital multimeter supports electrical checks at equipment level.
Build the Control Baseline from Takt and Task Times
For a 480-minute production window and demand of 400 units, takt time is 1.2 minutes per unit [S3]. The minimum theoretical station count is total work content divided by takt time, rounded upward, but the practical count must also respect precedence, equipment, skills, ergonomics, and required separation between operations [S2].
Capture the duration of each discrete task rather than only total station time, because task-level timing is what supports reassignment [S2]. Manual stopwatch-and-paper studies can introduce bias, while IIoT-powered time studies automatically capture machine and operator task completion data [S3]. The output should connect each event to a station, task, product, shift, operator, and timestamp rather than reduce the line to one average.
Build the baseline in five steps: time every task, calculate takt, identify the slowest station, move work from overloaded stations to stations with capacity, then re-time the revised line under operating conditions [S2]. Apply the same measure-analyze-improve-control logic used in DMAIC, where measurement establishes cycle times, analysis determines bottleneck causes, improvement implements the new allocation, and control sustains it through monitoring [S4].
Compare Main Balancing Methods by Decision Criteria
The practical choice is not one universal algorithm. Method selection depends on task detail, line variability, asset cost, and the need for operational feedback. Minitab line-balancing forms compare multiple operations on a process map or value-stream map against takt, providing a low-cost analytical route for predefined sequences [S6].
IIoT time study is stronger when the decision must follow live deviations, because cycle time and bottleneck identification can update from machine events [S3]. These approaches are complementary: simulation tests a proposed balance, while live data tests whether that balance survives actual production.
Where Real-Time Data Changes the Decision
Real-time data separates nominal balance from actual balance. A work assignment may pass a one-time study but fail when product mix, staffing, minor stops, blocked stations, or reduced machine speed changes cycle behavior [S1][S4]. Task capture should therefore distinguish normal processing from starvation, blocking, minor stops, and speed loss rather than treating every delay as labor content [S1].
For example, one process running above takt cannot feed the line at the required rate even if another process has spare capacity [S3]. If live data shows that condition, the intervention is not a blanket staffing increase. The first response is to inspect task allocation, precedence constraints, stop causes, machine capability, and available buffer before moving an operation.
Precedence diagrams provide the control structure for safe reassignment: each task is linked to its immediate predecessors, so Task 1 must finish before Task 3 begins when that dependency is recorded [S3]. Real-time dashboards then show whether cycle-time convergence is improving after the change. For broader plant context, ISA-95 levels explained through plant operations clarifies how line-level production data relates to plant, area, work-cell, and equipment records.
Use Live Metrics without Confusing OEE with Balance

OEE combines availability, performance, and quality into one production measure, but it does not by itself prove that tasks are balanced [S3]. Balance efficiency answers a narrower question: how much of the available station-time is occupied by required work relative to the bottleneck cycle [S1]. A line can have strong OEE and weak balance if downtime is low while one station still exceeds takt.
Track at least five values for each line: takt in seconds per unit, station cycle time in seconds, bottleneck cycle time in seconds, balance efficiency as a percentage, and queue or WIP at the constrained station [S1][S2]. Add OEE as a supporting loss metric, and preserve product and shift identifiers so mixed-model effects can be separated from normal variation.
For electrical stations, a DC power supply can support controlled test loads, while an electronic load can apply repeatable demand to power-related work elements. Neither measurement substitutes for production cycle timing: the balancing model still needs actual task durations, precedence, and takt time.
Control Limits, Failure Modes, and Human Checks
Do not set every station to exactly takt with no allowance for normal variation. The design objective is to bring each cycle below the takt ceiling with a deliberate operating buffer, because a station at the limit leaves no margin for normal processing variation [S1]. A station far below takt may also be unable to absorb an entire indivisible task or meet sequence and skill requirements [S2].
Three failure modes require separate responses. First, manual data can be biased, making the apparent balance unreliable [S3]. Second, product-mix or demand changes can invalidate a balance built for another takt, requiring recalculation and control adjustments [S2][S4]. Third, physical constraints can prevent the mathematically preferred allocation, including precedence, machine compatibility, operator skill, ergonomic load, and buffer placement [S2].
Set escalation rules around named indicators rather than subjective impressions: station cycle time above takt, balance efficiency below the plant's control target, a growing WIP queue, or repeated stop codes at one station. The target should be owned by operations, but any threshold must reflect the measured line and its process capability. Re-time after changes rather than assuming the paper balance remains valid [S2].
Roll Out a Measurable Rebalancing Loop

A workable implementation starts with one product family and one shift, defines takt in seconds per unit, records task-level cycle times, and publishes station cycle time against that takt [S1][S2]. The first test is operational: move only tasks permitted by precedence and physical constraints, then compare the bottleneck cycle, total task time, station count, and balance efficiency before and after reassignment.
Real-time data then maintains the loop by showing station deviations, stop causes, bottlenecks, excess capacity, and OEE [S3]. If improvement depends on trial task moves, the plant should preserve before-and-after values for cycle time, balance efficiency, WIP, and throughput. The next trackable signal is not a general claim of productivity, but whether the revised bottleneck remains below takt across repeated shifts and product variants.
By 2026-11-15, the defensible operating model is measurement, reassignment, validation, and continuous control. A data logger or connected production system can preserve the evidence, but the engineering decision still depends on valid task timing, explicit takt, confirmed precedence, and measured results after the line changes.