
Asia-Pacific commanded 40.25% of the 2025 machine vision systems market, with the top three suppliers holding roughly one-third of global revenue, per Mordor Intelligence's March 2026 baseline [S1]. Hardware accounted for 65.11% of 2025 component share, while 2D imaging led imaging type at 71.03% and PC-based architectures led product type at 58.02% [S1].
Cognex, Keyence, and Omron are consistently named as the vendor triumvirate across July-August 2026 reports, with Basler, Teledyne Technologies, Sony, and National Instruments rounding out the top tier [S3][S9]. Cognex reported 2024 revenue of USD 914.5 million, up 9% year-over-year, with logistics revenue up 20% and semiconductor revenue up 80% [S2].
2025 share by component, imaging type, and deployment
Hardware dominated the 2025 machine vision stack at 65.11% of revenue, while software is advancing at a 7.21% CAGR through 2031, reflecting the shift toward analytics-as-a-service bundles [S1]. Smart cameras are growing fastest within product type at a 7.92% CAGR, even though PC-based systems still hold 58.02% of 2025 share and FMI pegs PC-based at 55.0% for 2026 [S1][S3].
2D imaging held 71.03% of 2025 share, with 3D imaging expanding at a 7.21% CAGR, the fastest of any imaging segment [S1]. On-premises deployment led at 73.60% of 2025 share, while cloud-based platforms accelerate at 7.32% CAGR over 2026-2031 as vision-as-a-service contracts proliferate [S1]. Within industrial machine vision specifically, Fortune Business Insights puts 2D at roughly 48% of share in its August 2026 release, a wider scope that dilutes the 2D ratio [S4].
Vendor ranking: who actually leads
Cognex Corporation is named the world's leading dedicated machine vision company in SNS Insider's machine vision market report [S2]. Market Research Future's August 2026 outlook names Cognex, Keyence, and Omron as the three key players driving automation trends at a 10.69% CAGR [S9].
Future Market Insights' April 2026 vendor list extends the competitive set to Basler AG, Teledyne Technologies, Sony Corporation, and National Instruments alongside the top three [S3]. Coherent Market Insights' March 2026 release concurs with the same vendor hierarchy, though it places smart cameras ahead of PC-based at a 36.7% share, a divergence from Mordor's 58.02% PC-based figure that reflects different system-scope definitions [S5]. The disagreement is itself a sourcing signal: "smart camera" can mean either a compact vision sensor or a PC-replacement unit, and the 36.7% versus 58.02% spread traces back to that definitional split.
Market size: where the four trackers disagree

Mordor Intelligence sizes the 2025 machine vision systems market at USD 13.82 billion, growing to USD 14.95 billion in 2026 and USD 21.15 billion by 2031 at a 7.18% CAGR [S1]. SNS Insider reports a larger 2025 base of USD 18.75 billion, expanding to USD 50.71 billion by 2035 at 10.46% CAGR, with Asia-Pacific as both the largest and fastest-growing region [S2].
Future Market Insights sits at the low end with USD 10.7 billion in 2025, USD 11.57 billion in 2026, and USD 25.21 billion by 2036 at 8.1% CAGR [S3]. Coherent Market Insights lands at USD 14.67 billion in 2026, reaching USD 25.97 billion by 2033 at 8.5% CAGR, while Grand View Research tracks the broader computer vision market at USD 23.6 billion in 2025, growing to USD 101.5 billion by 2033 at 20.1% CAGR [S5][S7]. The dispersion is wide because each report draws a different boundary around embedded vision, smart cameras, and AI software, a sourcing caveat every procurement team should weight.
Regional split: Asia-Pacific dominance, Middle East acceleration
Asia-Pacific leads the 2025 machine vision systems market at 40.25% of revenue, per Mordor, and Coherent's March 2026 estimate puts the region at 44.3% of 2026 share [S1][S5]. North America holds 25.7% of 2026 share in Coherent's view, the fastest-growing region in that report, while FMI flags South Korea at 9.8% CAGR, the UK at 9.5%, Japan at 8.8%, and China at 8.5% as the country-level growth leaders [S3][S5].
The Middle East is the fastest-growing region in Mordor's framework at 8.43% CAGR over 2026-2031, driven by industrial-diversification agendas that pull sovereign capital into factory automation [S1]. The US machine vision market reached USD 3.13 billion in 2025 and is forecast at USD 9.46 billion by 2035 at 11.70% CAGR, per SNS Insider, anchored by concentrated vision-vendor presence and semiconductor fab capacity [S2].
End-use mix: automotive first, semiconductor fastest
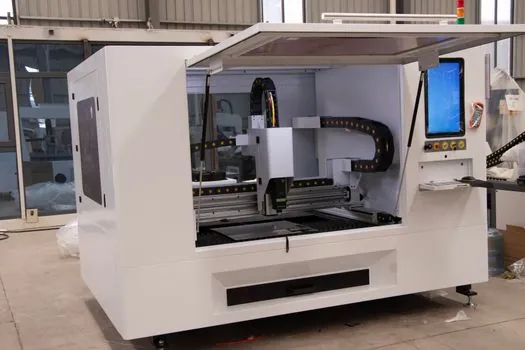
Automotive led 2025 end-user share at 23.85%, while healthcare and pharmaceutical applications are the fastest-growing vertical at 9.16% CAGR through 2031, per Mordor [S1]. FMI's 2026 estimate pushes automotive to 40% of industry share, a wider gap that again reflects definitional scope, and Coherent flags automotive, electronics, food and beverage, and pharmaceuticals as the four demand pillars [S3][S5].
Semiconductor inspection is the most volatile growth pocket: Cognex's 80% semiconductor-revenue jump in 2024, Teledyne DALSA's September 2024 launch of the Linea HS2 TDI line-scan camera family, and the broader 3D-machine-vision sub-market growing from USD 2.4 billion in 2026 to USD 5.8 billion by 2036 all point to inspection tolerance tightening with each new process node [S2][S8]. The 3D machine vision market alone was valued at USD 2.2 billion in 2025, per Fact MR's June 2026 release, and is the most quoted spec-driven sub-segment in vendor qualification documents [S8].
Selection criteria: what separates the top three from the rest
On-device AI inference chips now deliver sub-millisecond classification at the edge, a capability that lets semiconductor fabs and battery plants hold yields above 95% without cloud latency, and that is the single most cited vendor differentiator across the 2026 reports [S1]. Cognex's August 2024 sales-force disclosure flagged AI as the principal lever expanding addressable use cases, while Teledyne's HS2 launch targets line-scan throughput for semiconductor and battery inspection [S2].
Procurement teams should weigh four concrete criteria against vendor claims: (1) software stack depth, where Cognex and Keyence lead, (2) sensor and camera portfolio breadth, where Sony, Teledyne, and Basler anchor the supply, (3) system-integration ecosystem, where National Instruments and Omron compete on PLC and robotics coupling, and (4) regional service coverage, where Asia-Pacific vendors like Keyence and Omron have a structural advantage inside the 40.25%-share region [S1][S3]. FMI's principal consultant frames it bluntly: "the machine vision market is entering a specification-driven procurement phase where precision, compliance, and lifecycle economics define vendor qualification" [S3].
Limits, failure modes, and sourcing caveats

The single biggest trap in reading 2026 machine vision market data is confusing machine vision systems (MVS) with the broader computer vision market: Grand View's USD 23.6 billion 2025 figure includes consumer imaging, ADAS perception, and surveillance, three segments that Mordor's USD 13.82 billion MVS number explicitly excludes [S1][S7]. A second trap is the 2D-versus-3D split: Mordor's 71.03% 2D share for 2025 is MVS-wide, while Fortune Business Insights' 48% 2D figure is industrial-MVS only and pulls in 3D-heavy segments like robot guidance and dimensional metrology [S1][S4].
Third, vendor-revenue disclosures are uneven. Cognex files Form 8-K with the SEC and reports segment splits publicly; Keyence and Omron report on Japanese fiscal calendars with less granular product-line disclosure; Basler and Teledyne report in consolidated form. That asymmetry makes the "top three" claim in market reports a function of public-disclosure quality as much as market position [S2]. Finally, supply-chain risk is real and quantified: Coherent's March 2026 event log flags US-China export restrictions, nano-level chip shortages, and reshoring-driven regional price volatility as the three near-term procurement headwinds that could distort any 2026 share number by mid-2027 [S5].
The 3D machine vision sub-segment, sized at USD 2.2 billion in 2025 with a 6-8% growth profile, is the cleanest test case for vendor selection because spec sheets are comparable across suppliers; the line-scan, area-scan, and time-of-flight splits are well-defined and the tolerance numbers are auditable [S8]. For teams writing RFQs in late 2026, the practical signal is to anchor weighting on sub-millisecond edge-AI inference, on-device yield above 95%, and 3D dimensional accuracy, then back-solve the MVS-market percentages into vendor allocation.
Component reference pages worth checking: machine vision system, machine vision id, and vision measuring machine.
This topic is covered further in Power Cable Suppliers 2026: Spec-Driven Sourcing for T&D and Solar.