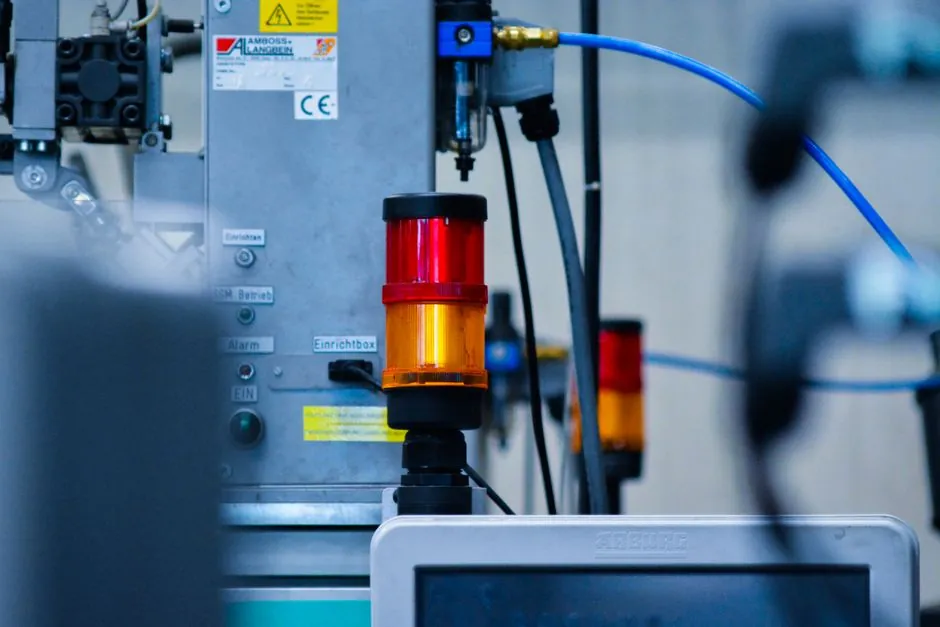
Topstar’s early TS series reference tables report hourly electricity consumption of approximately 5–20.9 kWh depending on the model, but these figures are not a universal range for all injection molding machines [S3].
The correct unit for procurement and budgeting is kWh per accepted mold, not rated kW: average actual power multiplied by operating hours yields kWh, which is then divided by qualified parts.
What kWh per mold actually measures
Energy per mold is the electricity consumed by the defined production boundary divided by the number of accepted parts produced during that interval. A useful boundary includes the injection-molding machine, barrel and hot-runner heating, mold-temperature control, chillers, compressed air, robots, conveyors, and material feeding when these loads are metered [S3][S5].
Three quantities must remain separate: installed power in kW, average operating demand in kW, and electricity consumption in kWh. For example, 12 kW averaged over an 8-hour shift equals 96 kWh; if 720 qualified parts were accepted, the process consumed 0.133 kWh per accepted part, before any separately metered auxiliaries [S3].
The result changes with lot size. Running 20,000 molds over one shift produces a lower plant-level kWh per part than producing 2,000 molds with the same heaters and auxiliaries, because heat-up and setup losses are spread across fewer parts. The boundary, duration, scrap definition, and included auxiliaries therefore matter as much as the final quotient.
Line power ranges provide a screening baseline
A separate machine-model reference gives approximately 5–20.9 kWh per hour across its listed series and explicitly warns against treating the range as universal [S3].
This per-cycle figure should not be transferred directly to a multi-cavity tool, because one machine cycle may produce several accepted molds.
For rapid screening, divide 15–25 kWh/h by the hourly output of a 100-ton line. At 60 accepted parts per hour, the machine-only range is 0.25–0.417 kWh per part; at 240 parts per hour, it is 0.063–0.104 kWh per part. These are mathematical illustrations, not plant benchmarks, and exclude unmetered heating, cooling, and auxiliary loads.
Compare drives under identical production
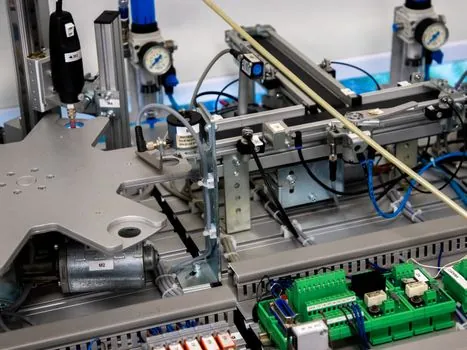
Drive type alone cannot determine kWh per mold. A fair comparison must hold material, tooling, part quality, cycle time, heating setpoints, and output constant. Hydraulic pumps can lose energy while maintaining pressure, all-electric drives avoid continuous pump operation, and hybrids can combine demand-based hydraulics with electric movement [S3][S5].
A decision table should compare at least four variables: measured kWh per accepted part, cycle time in seconds, heating load in kW, and idle or setup energy in kWh per changeover. A cheaper machine should not win if it needs a longer cooling time, runs fewer parts per hour, or shifts more energy into setup and standby.
Separate production energy from setup losses
Injection-molding energy consumption includes heating, cooling, hydraulic systems, and machine operation [S2]. Cooling, hydraulic operation, and prolonged setup can add material demand, especially where hot runners remain energized while the line waits for production [S5].
Production should be separated into steady-state molding, first-article setup, material or color changeover, planned idle, and unplanned stoppage. Metering only steady-state cycles can hide the load caused by heating a 20-tool production set before the first good part. It can also exclude standby consumption during short stops and repeated recovery heating.
Lot sequencing is another measurable variable. Changing the lot sequence in the production line reduced specific energy consumption from 2.19 kWh/product to 1.93 kWh/product [S6]. This result concerns one modeled configuration, but it demonstrates why scheduling and tool sequencing belong in an energy audit rather than in a generic machine comparison.
Heating and mold condition set the operating load

Heater-group resistance should be checked with a multimeter, and a heating coil operating below 85% of rated heating efficiency should be replaced [S8]. This test is operationally important because degraded or mismatched heaters can require more electrical input to maintain the same process temperature, although the source does not provide a universal kWh-per-part penalty.
The mold itself changes both the thermal demand and the achievable cycle. Injection volume, cavity count, material temperature, cooling time, and pressure requirements determine whether the machine and tooling operate near their useful capacity or spend time waiting [S1][S3]. Proper machine selection relative to the molded part directly affects electricity use, cost, and environmental impact [S1].
For an automatic molding line, baseline the line by cavity count and accepted-part output, then test at least one short cycle, one normal cycle, and one extended cycle. Record heater-zone power, hydraulic or servo power, cooling demand, cycle time, rejected parts, and idle intervals over the same interval.
Use production data, not nameplate assumptions
Electricity consumption is calculated as average actual power in kW multiplied by operating time in hours, then divided by accepted output to obtain kWh per qualified part [S3]. A database-based estimate of 1.47 kWh/kg for injection molding can support early mass-based screening, but it must not replace line metering because material mass is only one component of the energy model [S1].
A NIST-related approach estimates energy from the power and duration of individual process stages, including clamping, injection, holding, plastication, cooling, and ejection [S3]. For procurement, specify a measurement period, minimum load, meter model and accuracy class, interval length, product mix, and treatment of rejects. The molding line drawing should identify each metered auxiliary rather than hiding it inside a single machine reading.
The largest data gap is usually the boundary. A machine-only figure can exclude chillers, hot runners, compressed air, robots, and feeders, while the drive can account for less than half of total cell energy when those auxiliaries are included [S5]. Without a common boundary, two suppliers can both report valid numbers that are not comparable.
Verify savings against the accepted-part baseline
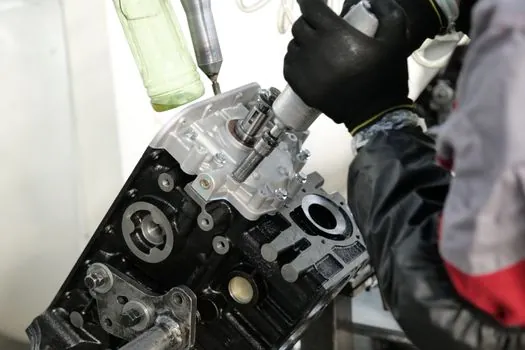
A valid energy project must report absolute meter readings, operating hours, accepted parts, rejects, cycle time, and auxiliary coverage before and after the change. It should also state whether the kWh figure includes setup and idle. Savings claimed only against nameplate capacity cannot demonstrate lower consumption at the plant level. [S3]
Track two signals on the injection molding machine: kWh divided by accepted mold and average operating kW during production. The first measures process productivity, while the second shows whether a retrofit changes machine demand. If kWh per mold falls but average kW rises, the result may reflect longer cycles or lower output rather than better energy efficiency.
The nearest candidate article concerns automatic molding line cost per mold per output hour. For energy procurement, retain its output-hour denominator and add the electrical variable, producing cost per accepted mold with the formula: measured cell kWh times electricity price, divided by accepted output.