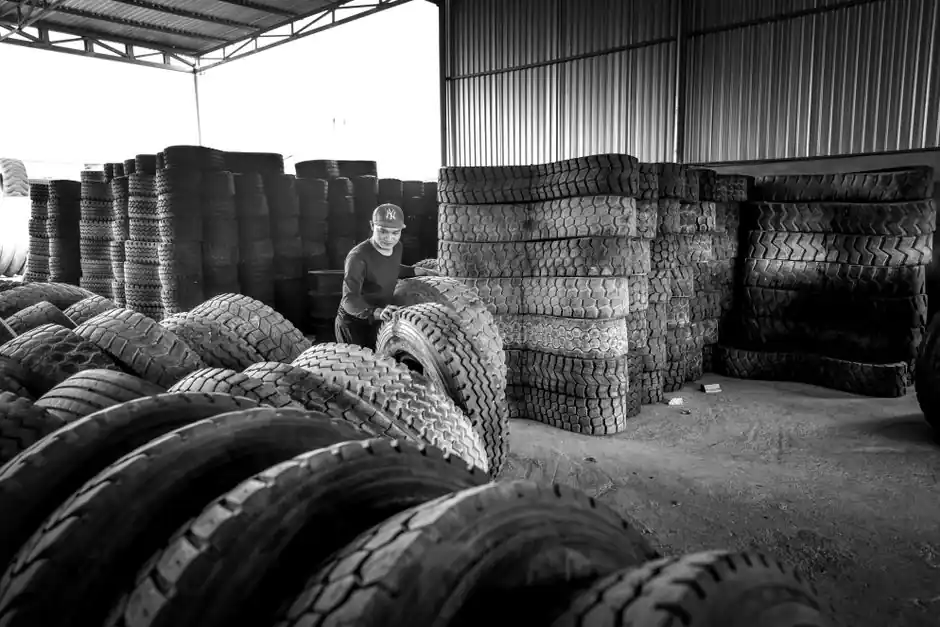
Global natural rubber demand was forecast to reach 15.356 million tonnes in 2026, exceeding projected production of 15.039 million tonnes by approximately 317,000 tonnes [S3].
Tire production remained one of the principal drivers of natural rubber consumption, while weather-related disruptions and constrained supply created pressure on the global tire raw material supply chain [S3][S4].
Price Range and Regional Benchmarks
As of May 2026, global natural rubber prices were trading steadily at around USD 2.28–2.38/kg [S1].
A separate Q2 2026 market measure placed the average at USD 2,680/MT, equivalent to USD 2.68/kg [S6]. The difference from the May global range of USD 2.28–2.38/kg reflects different benchmarks, grades or pricing methods, so buyers should compare the same grade and delivery basis before treating the figures as one series.
Supply and Demand Balances in 2026
ANRPC projected 2026 natural rubber production of 15.039 million tonnes, up 0.6% from 14.952 million tonnes in 2025 [S3]. Demand was forecast to rise 0.4% to 15.356 million tonnes from 15.301 million tonnes, producing the potential annual shortfall of approximately 317,000 tonnes [S3].
Monthly output remained volatile: August production was estimated at 1.396 million tonnes, 4.51% below the 1.462 million tonnes recorded in August 2025 [S3]. The annual balance also depends on producer inventories, trade flows and revisions to production and consumption, so the forecast gap is not equivalent to a physical shortage on any particular procurement date.
Earlier market analysis projected 2026 production growth below 1% and described the market as a tight balance with gradual upward price pressure, capped by synthetic-rubber substitution and soft demand in Europe and the Americas [S4]. A separate production study placed the 2021–2026 compound annual growth rate at 4.3% [S7].
Grade-by-Grade Price Signals

The comparison is driven by grade and market basis, not by a uniform global price move. SMR-20 and STR-20 are technically specified rubber grades, RSS grades refer to field-sheet rubber products, and bulk latex is a separate upstream material. Tire buyers should compare equivalent grade, certification, contamination level and delivery terms rather than use one benchmark for every purchase.
Tire Demand Drivers and Constraints
Tires account for approximately 70% of global natural rubber demand, making vehicle sales, replacement-tire consumption, tire exports and production schedules the main demand variables [S4][S5]. The forecast analyzes price trends for TSR 20 rubber and RSS 1–3 during 2025–2026 [S5].
Replacement demand provides support because the installed vehicle fleet continues generating tire wear independently of new-car sales. Electric vehicles also support natural rubber consumption because they remain vehicles requiring tires, although tire mix, weight, rolling resistance and compound design determine how much natural rubber is used per vehicle [S3][S5].
Selection Criteria for Tire Buyers

TSR 20, STR-20, RSS-3, RSS-4 and bulk latex cannot be ranked on price alone because they serve different applications. The decisive criteria are mechanical performance, tire type, technical compliance, contamination control, traceability, delivery location and contract volume. [S5]
For passenger tires, the cited market direction points toward RSS 1 and RSS 2 for grip, while TSR 20 is linked to high-tensile truck and industrial applications [S5].
Environmental and legal traceability has become a procurement gate rather than a marketing attribute. Demand for certified, legally traceable natural rubber is rising, and deforestation-related rules can affect producer access to end markets [S4][S5]. Buyers should preserve lot-level origin and chain-of-custody documentation through mixing and tire production.
Cost Drivers and Procurement Strategy
Natural rubber purchase cost is driven by plantation output, rainfall and tapping conditions, plant disease, labor availability, processing energy, freight, currency movements, producer inventory and tire demand [S1]. Production disruptions raise replacement cost and reduce spot availability, while adequate plantation arrivals and comfortable inventories limit sharper increases [S1].
Volume and grade structure also affect unit price. A high-volume tire plant can improve negotiation leverage and logistics utilization, but changing from a qualified TSR or RSS grade can require compound requalification, mixing trials and destructive testing. That transition cost can exceed the apparent saving from a lower benchmark quotation.
Total cost of ownership extends beyond the kilogram price. Mixing yield, scrap, energy consumption, cycle time, inventory carrying, freight, demurrage and line stoppage all affect the cost per saleable tire. A purchase strategy based on 3–4 months of TSR 20 inventory was recommended in the June 2026 forecast [S5]. That coverage can protect production from supply volatility, but it also raises financing and price-risk exposure, so buyers should avoid duplicating safety stock across every grade.
Synthetic Rubber Substitution and Market Limits
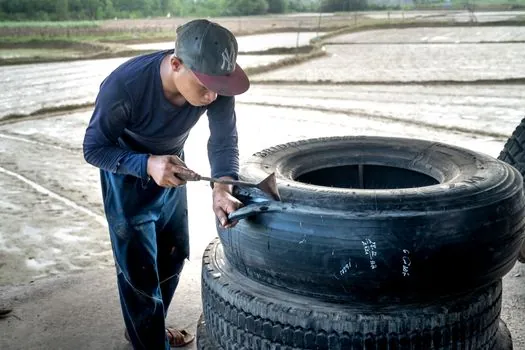
Synthetic rubber remains an important substitute in tire formulations alongside silica, carbon black, reinforcing fibers, steel cord and specialty chemicals [S2]. Substitution can cap natural rubber prices when supply tightens, but the applicable blend depends on tire performance requirements rather than commodity price alone.
Natural rubber retains a role because of its mechanical properties, fatigue resistance and performance in demanding tire applications [S3]. Buyers can use synthetic rubber to manage a specified portion of demand, yet changing formulation or blend ratios can alter fatigue, grip, rolling resistance, heat build-up and wear performance.
Demand growth is also constrained by uncertain vehicle production, replacement cycles, geopolitical risk, trade barriers and macroeconomic pressure [S2]. Global natural rubber demand grew about 2% in 2024 [S2], while the 2026 forecast calls for only 0.4% growth [S3]. A projected deficit can therefore coexist with price volatility if inventories, imports, exports and substitution adjust faster than plantation output.
Signals for Procurement and Market Balance
Three measurable signals deserve monthly attention: ANRPC production against the 15.039 million-tonne 2026 forecast, tire and automotive output against the 0.4% demand-growth assumption, and the spread between SMR-20 or STR-20 and RSS grades [S3]. A narrowing monthly production deficit would weaken the tightness case, while repeated output shortfalls below the annual path would support replacement buying [S3].
European tire trade actions also require separate monitoring because they can redirect Chinese tire exports and alter regional natural rubber demand [S4]. For purchase contracts, the trackable indicators are grade-level benchmark prices, freight-adjusted landed cost, inventory cover and documented origin, not a single global headline price.