
The global pharmaceutical equipment market is forecast to expand by USD 5.88 billion over 2025-2030, equating to a 6.1% CAGR, with the incremental opportunity concentrated in packaging lines, aseptic fill-finish skids, and single-use bioreactor capacity [S1][S2].
North America captures the largest regional share at 42.52% in 2025, while Asia-Pacific is the fastest-growing region on a 5.12% CAGR basis through 2031; Germany is repeatedly called out as a key European buyer [S5].
Headline Numbers: 2025-2030 vs 2026-2032 Forecasts
Three independent research houses converge on the same demand band, with the 2026-2032 view from MarketsandMarkets sizing the market at USD 21.24 billion in 2026 reaching USD 30.39 billion by 2032 (6.2% CAGR) [S3].
Mordor Intelligence sets a 2025 base of USD 25.93 billion, 2026 at USD 27.10 billion, and 2031 at USD 33.79 billion (4.51% CAGR over 2026-2031), with biologics now representing 62% of pre-clinical and clinical manufacturing runs [S5].
Technavio's 2026-2030 study aligns with Research and Markets at USD 5.88 billion of incremental value and a 6.1% CAGR; North America is sized at 38.3% of forecast-period growth [S1][S2]. Reading these three together, the realistic 2030 envelope for total pharmaceutical equipment spend is in the high-USD 20s to low-USD 30s, depending on whether you anchor to 2030 or 2032 [S2][S3][S5].
Segment Mix: Where the Capital Is Going
Packaging equipment is the single largest equipment-type line item, with solid dosage (tablets, capsules, powders) the largest end-product category in 2025, supported by generic-drug volume and chronic-disease prevalence [S3].
Within the equipment stack, aseptic fill-finish systems led 2025 revenue share at 29.55%, while quality-control and inspection instruments are advancing at a 4.85% CAGR through 2031, reflecting Annex 1-driven retrofits in Europe [S5]. For a sense of the plant-floor machinery these forecasts translate into, see the working spec map for construction machinery and equipment and the lighting equipment and electric lamps that grade-A cleanroom suites and GMP warehouses are typically specified around.
By manufacturing stage, drug substance production held 36.53% of 2025 spend, with quality-control and release testing projected to grow faster at a 5.75% CAGR through 2031 as PAT and digital-twin QA tools are deployed [S5].
End-User Split: Big Pharma vs CDMOs
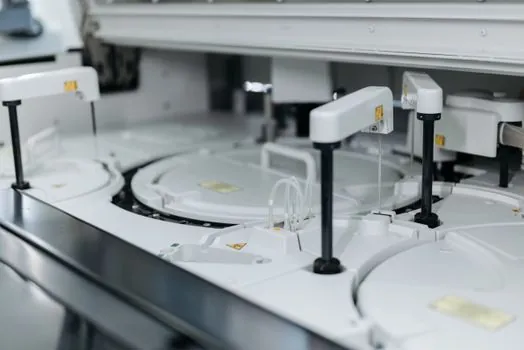
Big Pharma accounted for 42.15% of 2025 pharmaceutical equipment spending, but CDMOs and CMOs are growing faster at a 5.82% CAGR over 2026-2031, and consumed 28% of global bioreactor capacity in 2024, projected at 38% by 2028 [S5].
This CDMO pull matters for spec writing: a CDMO buying committee typically standardizes on modular single-use assemblies to compress validation from 18 months to under 6 months, and on continuous-flow skids for personalised-medicine batches [S5].
End-user mix also explains why demand for flow meter skids and pressure transmitter networks on buffer-prep skids is being specified as a single integrated skid rather than as discrete instruments, a pattern that shows up in vendor catalogues from GEA, Sartorius, and the wider process-pack builders [S1][S5].
Driver Stack: Biologics, Single-Use, Annex 1
Mordor's driver-impact table quantifies the contribution: biologics manufacturing volumes add +1.2% to CAGR, single-use tech +0.9%, GMP-driven equipment upgrades +0.7%, CDMO capacity expansion +0.8%, continuous manufacturing +0.5%, and Pharma 4.0 predictive-maintenance retrofits +0.4% [S5].
Installed global bioreactor volume is set to climb from 6.7 million L to 8.9 million L by 2028, with viral-vector lines the most constrained at 18-24 month equipment lead times, which is the binding constraint on gene-therapy launch cadence [S5].
Regulatory pressure is the most visible near-term catalyst: the EMA Annex 1 revision obliges isolators or restricted-access barrier systems (RABS) across roughly 1,200 European fill-finish suites, creating a multiyear retrofit backlog, while the FDA fast-tracks applications that deploy advanced manufacturing technologies, shortening commercial approval by 6 to 9 months and pulling capital spend forward [S5].
Regional Map: North America, Europe, Asia-Pacific

North America leads on absolute share (42.52% in 2025) and is called out as the region with the highest Pharma 4.0 predictive-maintenance retrofit uptake, alongside Germany [S5].
Asia-Pacific is the fastest-growing region at a 5.12% CAGR through 2031, with China named in the biologics-volume driver and Singapore plus India in the CDMO-capacity driver; the effect is a wider vendor footprint request for after-sales, FAT, and SAT support in those geographies [S5].
Europe's near-term story is regulatory: Annex 1 retrofit demand is concentrated in roughly 1,200 fill-finish suites, with Germany, the UK, France, Italy, the Netherlands, Spain, and Russia called out in regional segmentation tables [S2][S5].
Vendor Landscape: Who Is Spec-Listed
Research and Markets' vendor slate covers around 25 named suppliers, including ACG, Bausch+Strobel, Esco Lifesciences, Fette Compacting, GEA, Glatt, IDEX MPT, IKA Werke, IMA, Korber Pharma, Marchesini Group, OPTIMA Packaging, Pall, Romaco, Sartorius, SP Industries, Syntegon Technology, Thermo Fisher Scientific, and Uhlmann Pac-Systeme [S1].
Technavio identifies packaging equipment as the largest 2024 revenue line within type, with the solid product segment anchored at USD 9.96 billion in 2024 [S2]. The 2030 envelope for pharmaceutical packaging equipment alone, sized separately, is set to reach USD 14.3 billion by 2030 from a 2025 base of USD 10.5 billion, a 6.0%-ish trajectory in line with the wider market [S6].
For procurement teams building an approved-vendor list, the practical signal is that the top end of the market is consolidating around German and Italian packaging machinery (Syntegon, IMA, Marchesini, OPTIMA, Romaco, Uhlmann, Korber, Fette Compacting, Glatt) plus the US process-platform players (Sartorius, Pall, Thermo Fisher, SP Industries) [S1][S3].
Watch-Items Through 2030
Three trackable signals stand out for the 2026-2030 window: bioreactor lead times (18-24 months for viral-vector lines in 2024-2025) as a proxy for gene-therapy throughput [S5]; the rate at which the ~1,200 European fill-finish suites complete Annex 1 retrofits [S5]; and the Asia-Pacific capacity ramp, where the 5.12% CAGR through 2031 will show up first in anti-static equipment orders for new powder-handling suites, and in order books for the industrial fastener classes that hold stainless frames and skid skids together [S5].