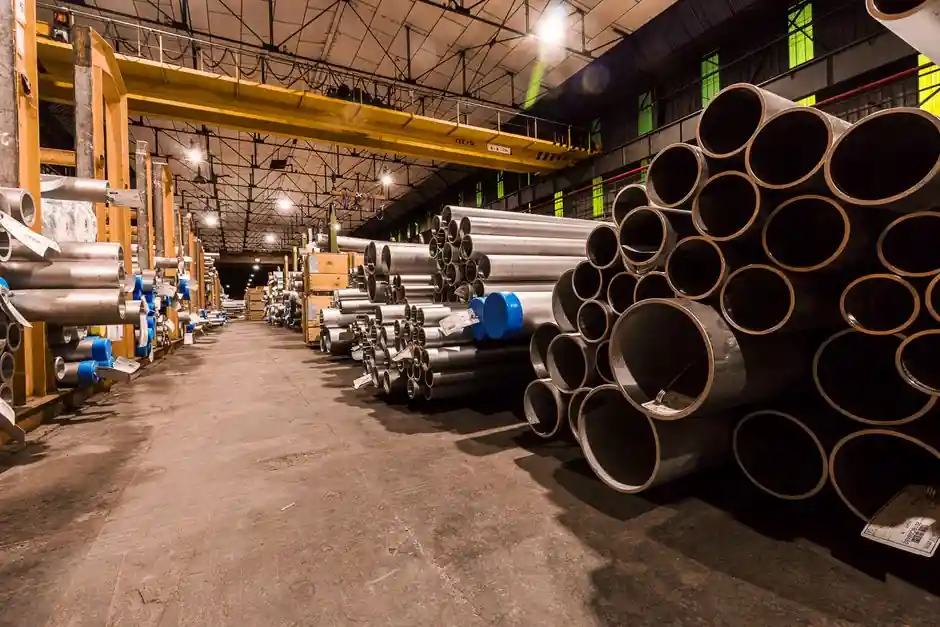
Total Cost of Ownership (TCO) for a piping system equals the initial pipe and fitting purchase price plus execution costs (excavation, logistics, labor, fusion or threading), plus operating costs (heat loss, pumping energy, carbon allowance), plus maintenance and end-of-life resale or disposal, with most published models adding an explicit "fittings complexity factor" of 1.4x and resin cost accounting for 75-85% of manufacturing OpEx for polymer systems [S1][S3][S5].
Across the major vendor frameworks circulating in 2025-2026 (LOGSTOR for pre-insulated district heating, Tenaris for OCTG and process plant pipe supply, and Longye for PPR plumbing), the TCO equation is structurally identical but the dominant cost driver shifts with material: energy losses for district heating, surplus and rework for EPC pipe supply, and fittings-plus-labor for plumbing [S1][S3][S5]. The reference pipe fitting category page covers the full taxonomy of materials, joints, and pressure classes that feed any TCO model.
The Four Cost Buckets in a Piping TCO Model
The Tenaris TCO Model defines the final pipe cost as Initial Pipe Price plus Execution Costs plus Unforeseen Costs plus Pipe Surplus, with execution and surplus combined typically exceeding the mill price on large downstream projects [S3].
LOGSTOR's district-heating TCO tool separates the same lifecycle into investment (pre-insulated materials, excavation, installation) and operating (heat loss, carbon allowance) buckets, then returns CAPEX/OPEX and payback time for two competing pipe solutions side by side [S1]. For plumbing, the comparable split is Materials plus Fittings (multiplied by a 1.4 complexity factor) plus Labor Hours times Hourly Rate plus Logistics and Waste Allowance [S5]. All three frameworks converge on the conclusion that the mill or meter price is rarely more than 40-60% of the 25-year lifecycle cost on infrastructure-grade work.
Material and Coating Trade-offs Across a 25-50 Year Service Life
Coated steel pipe service life in infrastructure applications runs 30-50 years, versus 25-35 years for FBE (Fusion Bonded Epoxy) alone and longer for 3PE (three-layer polyethylene) in harsh, corrosive soils [S4].
FBE has a lower initial procurement cost than 3PE and is preferred in moderate, dry, or neutral-pH environments with minimal maintenance, while 3PE carries a higher upfront premium but pays back in aggressive soils and high-moisture or chemical exposures through reduced repair frequency and downtime [S4]. The general PE pipe reference is relevant here for understanding how 3PE's outer polymer wrap compares with standalone PE service. For plastic-versus-metal decisions in plumbing, the 25-year tipping point typically falls in the 7-12 year band: metal fittings (copper, brass, stainless) carry higher purchase and labor cost but a 40-50 year service life, while PPR and other polymer fittings eliminate solder, thread sealant, and most corrosion-driven callbacks, with the 1.4 fittings complexity multiplier amplifying any layout change in a multi-story residential block [S5][S7].
Who TCO Analysis Is For, and Where It Misleads
TCO modeling is built for capital projects where the asset will be operated for 15+ years: district heating networks, oil and gas gathering, water and wastewater trunk mains, and large commercial plumbing risers, where heat loss, pumping energy, and corrosion-driven maintenance dominate the lifecycle bill [S1][S3][S4].
It is not the right tool for short-tenancy residential repipes, temporary process skids, or prototype lines where the operating horizon is under 5 years; in those cases, ROI on inspection equipment and simple payback on a single tool rental (the 0.2-year payback and 1924% five-year ROI shown in one published pipe-inspection calculator [S2]) is more decision-relevant. TCO also misleads when the discount rate is set unrealistically high, which suppresses long-horizon energy and carbon costs and reverts the model to a CAPEX-only comparison, or when scrap and resale value at end-of-life are omitted (TCO definitionally subtracts residual value from accumulated cost) [S2][S6].
Decision Criteria: Coated Steel, Polymer, and Pre-Insulated Compared
Across four decision criteria, the three dominant piping families rank as follows: on initial cost, FBE-coated carbon steel is lowest, PPR and HDPE polymers are next, and 3PE-coated steel plus pre-insulated district heating systems are highest; on service life, pre-insulated steel district heating (30-50 years) and 3PE-coated steel tie at the top, FBE sits in the middle at 25-35 years, and PPR/HDPE round out at 25-30 years in properly designed systems [S1][S4][S5][S7].
On installation labor, polymer heat-fusion joining is the lowest because it eliminates solder, thread sealant, and most weld inspection; FBE and 3PE field-joint coating is the highest because every girth weld needs re-coating and holiday detection; pre-insulated district heating is mid-pack because the factory-applied jacket reduces field work but joint foaming remains a critical path [S1][S4][S5]. On maintenance and operating cost, pre-insulated district heating wins on heat-loss reduction, 3PE wins on corrosion-driven repair avoidance, and polymer wins on internal scale and corrosion immunity in aggressive water chemistry [S1][S4][S7]. Field practice for cut, remake, and torque on threaded and flanged joints is documented in the related pipe and tube fitting installation guide, which feeds directly into the labor bucket of any TCO model.
Cost-Driver Ranking for 2026 Procurement
For PPR plumbing in 2026, ranked by share of installed cost: fittings (with the 1.4x complexity factor applied) typically exceed the pipe line item in complex residential layouts, labor runs second, raw resin cost (75-85% of OpEx, tracking crude within 30-60 days) is the dominant material-side variable, and logistics plus waste allowance closes out the model [S5].
For pre-insulated district heating, the same ranking shifts: factory-insulated material is the largest line, excavation and backfill are the second-largest, heat-loss operating cost over 30+ years typically equals 20-40% of the present-value bill, and carbon allowance pricing is the swing variable for European projects under the EU ETS trajectory referenced in vendor TCO tools [S1]. For EPC pipe supply on oil and gas or process plants, Tenaris's TCO framing puts pipe surplus and last-minute isometric changes above pure unit price, with downstream rework and inspection cost as the next-largest hidden drivers [S3].
Limitations, Failure Modes, and What Skews the Number
The published TCO calculators all carry the same caveat: they do not account for inflation, depreciation, or Net Present Value discounting unless the user builds it in [S2].
Common failure modes that derail a TCO-based decision include: omitting the 1.4 fittings complexity factor on layouts with many branches, treating all coatings as equivalent in soil-resistivity below 1000 ohm-cm where 3PE is mandatory, ignoring pump energy in long water mains where a 1 mm roughness increase can add 5-8% pumping cost over 25 years, and assuming a polymer system will not exceed its pressure-temperature derating curve in recirculating hot water above 60 C. Standard references for material selection, including ASTM and ISO pressure-temperature ratings and the corrosion allowances in NACE MR0175 for sour service, are the gating inputs; substitute them with vendor brochures and the TCO number will be off by 30-100% on operating cost alone [S4][S6].
Standards, Sourcing, and a Trackable Next Signal
Procurement-side sourcing patterns now favor Asian mills for PPR and pre-insulated pipe due to integrated petrochemical capacity and lower resin logistics cost, with ISO 15874 and DIN 8077/8078 cited as the quality gates buyers should require on shipment [S5].
For nickel-bearing stainless and alloy fittings, the related nickel raw material sourcing guide maps how EU critical-material status moves the upstream cost in piping fitting budgets.