A continuous sand mixer running two shifts typically carries a 10-15 year service life, and over that horizon, energy, wear-part replacement, and unplanned downtime account for an estimated 60-75% of lifecycle cost while the original purchase invoice represents 20-30% [S1][S5].
For foundry buyers, the practical implication is that two mixers with similar quoted prices can diverge by 25-40% in TCO once motor efficiency, muller wheel life, and lining wear intervals are modelled across a decade of operation [S1][S8].
What TCO Means for a Foundry Sand Mixer
Total cost of ownership captures every dollar from requisition to scrap, and the USPS Supplying Practices framework formalises the formula as TCO = P + Present Value of (O + T + M + W + E − S), where P is purchase, O is operating, T is training, M is maintenance, W is withdrawal/disposal, E is environmental, and S is salvage [S1]. A TCO analysis is explicitly designed to surface costs that budget planning and purchase decisions routinely overlook [S1][S5].
Applied to foundry sand mixers, the same equation forces a buyer to convert a quoted unit price into a per-tonne or per-shift cost over 80,000-120,000 operating hours, which is the typical design band for resin-sand and green-sand lines running 250-300 working days per year.
Cost Drivers Ranked by Lifecycle Weight
Driver 1 — Energy. A 30-50 kW drive motor running 16 hours per day consumes 175,000-292,000 kWh per year; at industrial tariffs of USD 0.08-0.12/kWh, the annual electricity bill alone lands between USD 14,000 and USD 35,000, which over a 10-year horizon is often the single largest TCO line. Driver 2 — Wear parts. Muller wheels, scraper blades, and polyurethane or Ni-Hard liners on a sand mixer are scheduled-replacement items at 6,000-12,000 hour intervals; budgeting USD 2,500-6,000 per major wear-part event is realistic for mid-size units. Driver 3 — Maintenance labour. Driver 4 — Downtime opportunity cost. An unplanned 8-hour stop on a high-mix line can erase USD 8,000-25,000 of throughput, which is why mean time between failures (MTBF) directly enters the TCO equation [S1][S8][S10].
Driver 5 — Installation and foundation. A vibrating resin sand line mixer often needs reinforced civil works, dust extraction tie-in, and a dedicated MCC, which can add 8-15% to the delivered price before commissioning. Driver 6 — End-of-life disposal and resin-bonded sand residue handling; EU and US environmental rules classify spent foundry sand as a controlled waste stream, so disposal cost (E in the TCO formula) is non-trivial and should be reserved [S1].
Mixer Types Compared on TCO Criteria
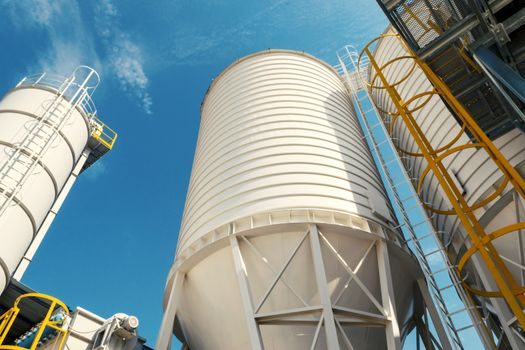
The four common architectures — continuous muller, batch muller, high-speed rotor (counter-current), and vibration-assisted sand cooler-coupled systems — line up against the four cost drivers as follows. [S1]
Continuous mullers win on throughput-per-kWh for high-volume green-sand plants above 30 t/h but pay back through longer muller-wheel change intervals and a heavier foundation. Batch mullers remain the cheapest to install and easiest to maintain for jobbing foundries under 10 t/h, with the trade-off of higher labour per ton. High-speed rotor mixers dominate resin-sand and chemically bonded lines because the 60-120 second cycle time crushes energy-per-ton; the catch is that rotor tip and liner wear compresses to 4,000-8,000 hour intervals. Vibration-augmented units sit in a premium niche where sand temperature and consistency justify the 30-50% capital premium [S1][S8].
Selection Criteria and Spec Levers That Move TCO
The first lever is motor efficiency class: IE3 vs IE4 vs IE5 on a 30-50 kW main drive typically saves 3-6% on annual kWh, which compounds to 8-15% of TCO over a decade. The second lever is the wear-part material grade — Ni-Hard, high-chrome white iron, or polyurethane-lined pans can change replacement intervals by a factor of 1.5-2.5x. The third lever is dust and resin fume containment: integrated enclosures reduce environmental compliance cost (E) and worker exposure, which indirectly lowers insurance and turnover. [S3]
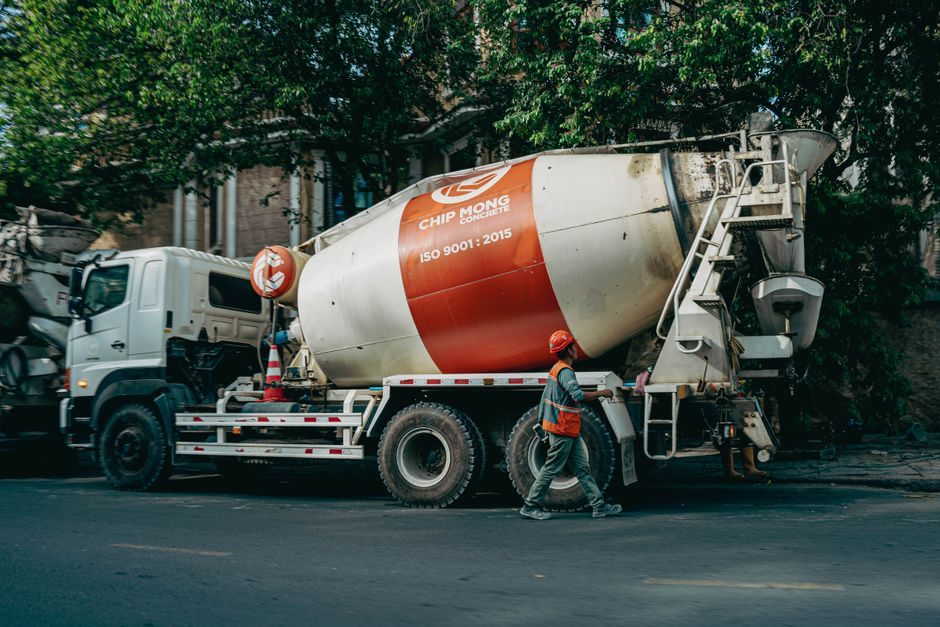
For green-sand duty, buyers should match a concrete-mixer-truck-style continuous geometry only if the plant already runs that logic; for chemically bonded resin systems, the high-speed rotor geometry is almost always the lower-TCO answer once cycle time is monetised. The fourth lever is the control architecture: VFD-driven shafts let the plant match tip speed to sand temperature, cutting motor energy by 10-20% during partial-load conditions common on Friday afternoon shifts.
Who TCO Modelling Is For, and Where It Fails
TCO modelling pays off on capital items above USD 50,000, on equipment with multi-year life, and where downtime cost is measurable — exactly the profile of a foundry sand mixer [S1][S10]. It is overkill for low-cost consumables and for short-tenure rentals under 12 months, where the operating-cost terms collapse and the formula is dominated by P alone. The model also breaks down when the M (maintenance) term is not tracked: many mid-size foundries still run on paper logs, which makes the present-value adjustment for M unreliable [S1][S5].
Buyers should re-estimate TCO at every major contract milestone — typically at purchase, at 30% life, at mid-life overhaul, and at replacement decision — because USPS practice treats TCO as a living estimate, not a one-time figure [S1][S5].
Standards, Sourcing, and Documentation
Foundry sand mixers fall under machinery safety regimes (ISO 12100 for risk assessment, EN 60204-1 for electrical equipment of machines, ISO 9001 for supplier quality systems) and, where ATEX zones 20/21 are declared around resin or fines, ATEX 2014/34/EU and IEC 60079 series for dust-explosion protection. Noise emission should be measured against ISO 3744 and declared at the workstation; vibration on hand-held add-ons against ISO 5349. Foundries exporting to the EU should also expect CE documentation including the Declaration of Conformity and a full technical file at delivery. None of these certifications move the purchase price much individually, but missing any one of them blocks commissioning and inflates W (withdrawal) costs later [S1][S8].
For the lifecycle numbers used above, the Crane Scale Price and Cost Guide: 2026 Tier Map and Buying Specs article uses an analogous wear-part tiering approach that maps cleanly to mixer scraper and wheel replacement, while the Core Making Machine TCO: Lifecycle Cost Drivers, 10-Year Map, and Sourcing Specs piece applies the same 10-year present-value method to the downstream machine the sand mixer feeds, so the two analyses can be stitched into a single line-level TCO.
The next signal to track is the 2026 utility-tariff revision cycle in EU and US industrial zones, which directly moves the O term in the TCO formula and can flip a borderline specification case; buyers should also watch the foundry-grade high-chrome white iron supply, which tightened through 2025-2026 and is the most common reason wear-part intervals drift against original projections.