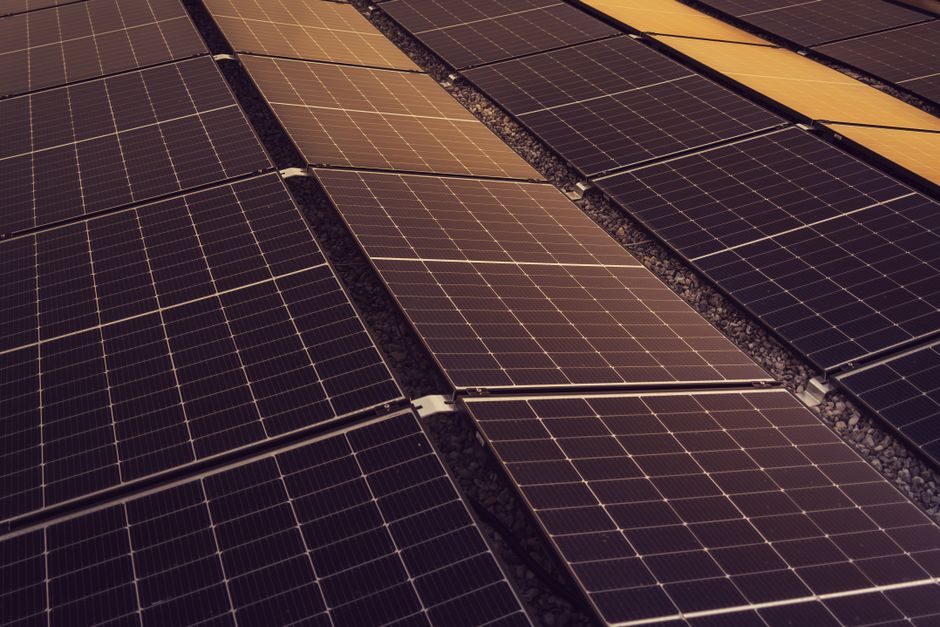
The global solar energy market reached USD 217.51 billion in 2025 and is forecast to grow to USD 606.18 billion by 2030 at a 22.5% CAGR, while the solar PV installed base alone is projected to scale from 2.34 TW in 2025 to 7.23 TW by 2031 at a 19.92% CAGR [S1][S3].
Crystalline silicon, perovskite tandems, and thin-film architectures dominate the technology split, with Asia-Pacific holding roughly 64.3% of 2025 PV demand and the Middle East and Africa tracking a 21.5% CAGR through 2031 [S3]. For process engineers specifying balance-of-plant instrumentation around solar farms, the flow meter and pressure transmitter workloads shift as module ASPs and utility-scale pipeline volume both move.
Market Size Anchors: USD, TW and Module ASP
The Business Research Company puts the 2025 solar energy market at USD 217.51 billion, expanding to USD 268.93 billion in 2026 (23.6% YoY) and USD 606.18 billion by 2030 at 22.5% CAGR [S1]. Mordor Intelligence frames the same trajectory in deployment terms: 2.34 TW installed base in 2025, 2.91 TW in 2026, and 7.23 TW by 2031 [S3].
Module average selling prices dropped to USD 0.082 per watt-peak FOB China in July 2025, a 32% decline from early 2024, and now sit below the USD 0.09/Wp threshold that has unlocked grid-parity in 142 countries where utility-scale PV undercuts coal and gas by 15-25% [S3]. A separate Grand View Research estimate pegs the 2023 solar cell market at USD 116.1 billion with a 16.4% CAGR to USD 333.8 billion by 2030 [S6]. The methodology gap (revenue versus installed base) explains the headline spread: both datasets are internally consistent within their own scope.
Technology Split: Mono-Si Dominance vs Tandem Acceleration
Monocrystalline silicon captured 86.1% of 2025 solar panel shipments, while tandem and perovskite architectures are forecast to grow at a 31.1% CAGR to 2031, with laboratory tandem cell efficiencies already exceeding 34% [S3]. The business-research segmentation breaks panels into mono-crystalline, thin-film, and poly-crystalline subsegments, and further splits cell-level inputs into solar cell panel, solar cell paste, and solar silicon wafer [S1].
Polyimide film demand, a critical upstream for flexible solar cells, is forecast to reach USD 2.10 billion by 2026 at a 7.9% CAGR, with flexible solar cells listed as a primary application segment alongside flexible printed circuits and high-temperature wire insulation [S2]. For procurement teams, the takeaway is that flexible-cell demand is no longer a niche line item: it sits inside a polymer market that is structurally tight through 2031.
Deployment Mix: Ground-Mounted, Rooftop and Floating PV
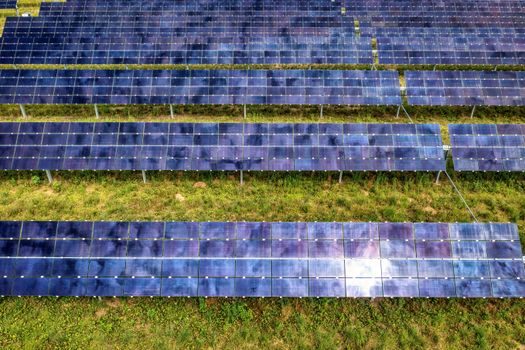
Ground-mounted arrays held 75.5% of 2025 installed capacity, floating PV is forecast at a 30.5% CAGR through 2031, and residential installations are tracking a 22.7% CAGR from 2026 to 2031 [S3]. Utility-scale independent power producers drove 63.2% of 2025 end-user demand, meaning that the bulk of new gigawatt-hours added in 2026 will still flow through large IPP balance sheets and corporate PPAs rather than residential rooftops.
Floating PV growth at 30.5% CAGR has direct instrumentation implications: water-side mounting forces stricter IP ratings on pressure sensor housings and accelerates the use of corrosion-resistant alloys on submerged cable terminations. Agrivoltaics, listed by Mordor as a 1.2% CAGR uplift, extends the same dynamic into dual-land-use sites where dust and humidity profiles differ from standard desert megaprojects [S3].
Geographic Weight: Asia-Pacific, MEA Growth Corridor
Asia-Pacific commanded 64.3% of 2025 PV market share, with China acting as the pricing benchmark (USD 0.082/Wp FOB, July 2025) [S3]. The Middle East and Africa region is forecast to grow at 21.5% CAGR through 2031, driven by green-hydrogen electrolyzer demand in Saudi Arabia, the UAE, and Oman, plus a 2.9% CAGR uplift attributed to electrolyzer offtake in the Mordor driver model [S3].
IRA-driven on-shoring in the United States is modeled as a 3.8% CAGR uplift for North America through 2028, while falling module ASPs contribute 4.2% globally with the strongest impact in India, Southeast Asia, Latin America, and Sub-Saharan Africa [S3]. The five largest module suppliers controlled 68% of 2025 shipments, a market-structure data point that determines lead-time risk for any procurement officer writing multi-year PPAs.
Driver Stack: Pricing, Policy, AI and Hydrogen Offtake
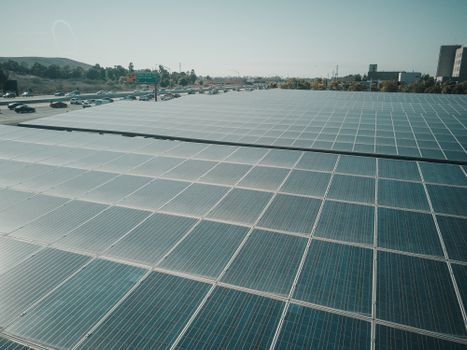
Mordor's driver impact table quantifies six headwinds and tailwinds: falling ASPs (4.2% CAGR impact, global), IRA on-shoring (3.8%, North America), green-hydrogen demand (2.9%, Middle East/Europe/Chile), corporate 24/7 clean-power PPAs (2.6%, North America/Europe/Japan), AI-enabled solar forecasting (1.5%, advanced grids), and agrivoltaics (1.2%, Europe/US/India/Japan) [S3]. The "Falling module ASPs widen grid-parity zones" driver alone is responsible for nearly a fifth of the headline 19.92% PV CAGR, and is reinforced by the 142-country grid-parity threshold [S3].
Tandem cell efficiency records above 34% and the production-tax-credit framework in the US are explicitly called out as momentum drivers, while AI forecasting and battery pairing are listed as revenue diversifiers that improve project IRRs without changing the underlying module spec [S3]. For spec-driven sourcing, the implication is that EPC contractors increasingly demand plant-level data infrastructure alongside the modules themselves, which raises the bar on load cell and tracker monitoring integration.
Adjacent Demand: Solar Vehicles, Portable Panels and Storage Coupling
The solar vehicle market report segments demand by BEV, HEV, and PHEV architectures and by monocrystalline versus polycrystalline panel types, with neighborhood vehicles listed as a distinct sub-application [S4]. The portable solar panel market, tracked separately by IndustryARC, remains a fragmented consumer-and-prosumer segment with its own 2020-2025 forecast horizon [S5]. Both segments feed back into the upstream polyimide, wafer, and paste markets covered in the main S1/S2/S3 datasets.
Coupling solar with storage is identified by Business Research Company as a forecast-period growth driver, and the integration trend is reinforced by the 1.5% CAGR uplift attributed to AI-enabled forecasting and battery pairing in Mordor's model [S1][S3]. For EPCs evaluating bankability, storage-coupled PPAs now carry different curtailment and balancing assumptions than 2020-vintage solar-only contracts.
Specification and Sourcing Gates for 2026 Procurement
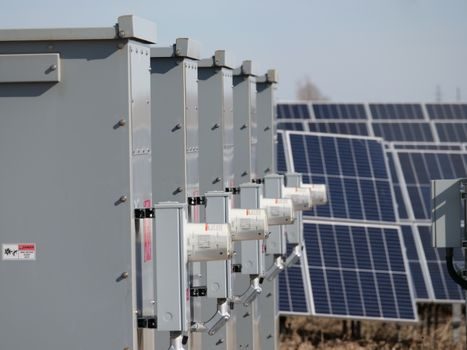
Procurement gates in 2026 are driven by four measurable thresholds: module ASP below USD 0.10/Wp (USD 0.082/Wp FOB China, July 2025), 21% module efficiency regulatory thresholds, tandem cell efficiency above 34% as a roadmap anchor, and 142-country grid-parity coverage [S3]. Market concentration is high: the top five suppliers controlled 68% of 2025 shipments, which means dual-sourcing strategies need to look beyond the headline five for second-tier supply [S3].
For balance-of-plant, the growth of floating PV at 30.5% CAGR and residential at 22.7% CAGR both raise the spec bar on enclosure ratings and corrosion resistance, directly affecting industrial valve and instrumentation sourcing for hydronic and cooling loops [S3]. Specification teams writing 2026 RFQs should anchor efficiency, degradation, and ASP clauses to the Mordor and Business Research Company datasets cited above, and treat the 22.5-23.6% headline CAGR as a planning envelope rather than a vendor commitment.
Two trackable signals for the next reporting window: the next quarterly FOB China module ASP print, and any update to the 21% module efficiency regulatory threshold, which together set the floor for both grid-parity expansion and the solar inverter market specification envelope through 2027.