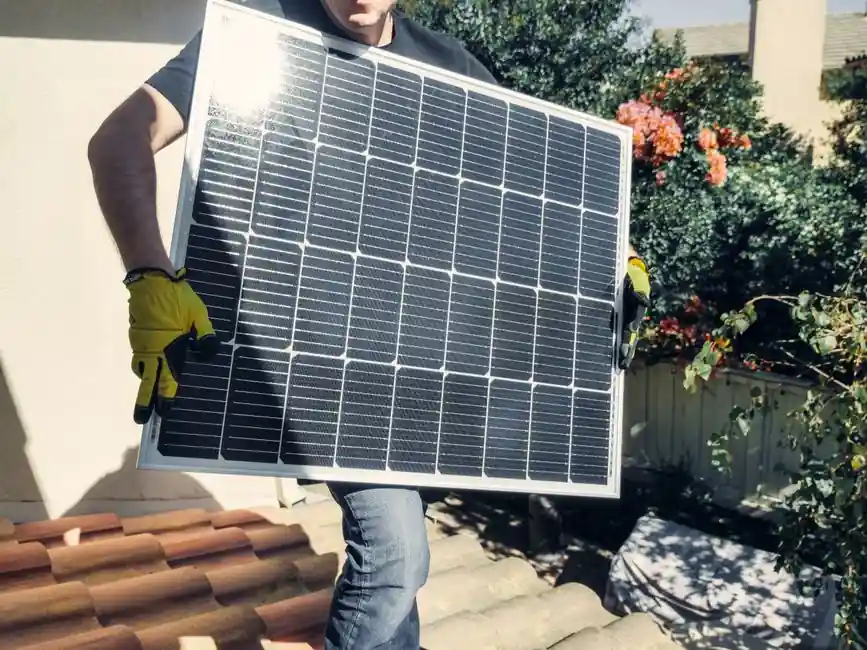
A 2026 TOPCon cell cost stack is dominated by three line items, silver metallisation, the n-type wafer, and the back-end passivation/deposition capex tied to LPCVD or PEALD tools, with silver paste still the single largest non-wafer variable cost on a RMB/W basis.
The decomposition matters because the same module watt (for example a 670 W TOPCon panel with cell efficiency above 25% and a temperature coefficient of -0.30%/°C, as listed in commercial 2026 datasheets [S3][S5]) carries a different bill-of-materials profile than the legacy PERC line it often replaces on a converted floor.
Where the cost actually lives: the 2026 TOPCon BoM stack
The cost of a TOPCon cell in 2026 is the sum of five large buckets: silicon wafer, silver and silver-aluminium paste, target/precursor gases for the tunnel oxide and polysilicon layers, anti-reflection and capping dielectrics (Al₂O₃/SiNₓ), and the consumables and depreciation tied to PECVD/LPCVD/PEALD reactors [S4][S7]. On a fully loaded basis the n-type wafer alone typically sits in the 35-45% range of cell cash cost, while the metallisation block (front Ag grid + back Ag/Al) usually lands in the 20-30% range, with the exact split moving with the silver spot price and the number of busbars printed [S2][S4].
The passivation sub-stack is small in dollars but large in process risk: a 1-2 nm SiO₂ tunnel oxide plus a phosphorus-doped polysilicon film on the rear, capped by Al₂O₃/SiNₓ, drives the efficiency gap to PERC and is the main reason commercial TOPCon cells now ship at 25% average efficiency with 9.55 Wp/cell on 182.3 × 210 mm wafers [S1][S4]. Each additional process step beyond a standard PERC flow, especially the polysilicon deposition and the high-temperature anneal, adds tool depreciation and gas consumption that the BoM line "depreciation + consumables" has to absorb.
Cost drivers, ranked by 2026 leverage
Silver paste is the most volatile single input, because the front-side grid on a 16-busbar, 36-micron finger design uses 80-120 mg of silver per cell and a 1-2 step reduction in screen-printed silver, or a switch to copper plating, can move cell cash cost by single-digit RMB/W [S2][S4]. The n-type Cz wafer is the second-largest lever: thinner wafers (around 130 μm trending toward 110 μm) cut silicon use, but raise breakage and yield-loss costs, so the net savings depend on line yield and diamond-wire slurry reclaim [S4][S7].
Depreciation and consumables for the rear-side deposition tool is the third lever, and it splits by architecture: PERC line conversions typically keep PECVD for capex reuse, while greenfield TOPCon lines favour LPCVD for efficiency headroom, with PEALD sitting between them on throughput and enabling sub-nanometre SiO₂ control [S7]. A short verbatim from the process literature underlines the trade-off: "PERC line conversions tend to pick PECVD for capex reuse and single-side processing, while greenfield capacity leans to LPCVD for efficiency headroom" [S7]. Energy, labour, and target/precursor gases (PH₃, SiH₄, NH₃, N₂O, BBr₃) round out the rest of the stack and are usually sub-5% each at module scale.
Comparison: PERC vs TOPCon vs HJT on the cost axes that matter
Stacking the three architectures against the four criteria that drive 2026 procurement decisions produces a clean matrix. On silver intensity, HJT requires the most silver because of low-temperature pastes on both sides, PERC the least, and TOPCon sits in the middle with the standard high-temperature Ag/Al stack on the rear [S2][S4].
On bifacial factor, TOPCon and HJT both reach 80-85%, well above PERC's roughly 70%, which improves effective LCOE even when cell cash cost is slightly higher [S3][S4]. On degradation, TOPCon's first-year degradation is below 1% with a 30-year output not less than 87.40% of original, and a temperature coefficient of -0.29%/°C that yields up to 2% more power than PERC at high cell temperatures [S3]. The combined reading is unambiguous: for a buyer who weights $/W and energy yield together, TOPCon is the 2026 default, with HJT reserved for specific weak-light or premium rooftop use cases and PERC relegated to legacy inventory.
What cuts cost, what does not, in 2026
The two largest 2026 cost-reduction levers are silver-displacement metallisation (copper plating, silver-coated copper, or reduced-print Ag pastes with finer 36-micron fingers) and wafer thinning, because both attack the top two BoM lines at the same time [S2][S4]. A secondary lever is deposition-tool choice, since the LPCVD-vs-PECVD-vs-PEALD decision directly sets depreciation, gas consumption, and uptime, with in-situ PH₃/POCl₃ doping during poly-Si deposition reducing a separate anneal step and its associated furnace capex [S7].
Larger formats, for example the 2465 × 1134 × 30 mm module frame at 34.7 kg ± 3% seen on 2026 N-type TOPCon modules, do not by themselves lower cell cash cost but do lower balance-of-systems cost per watt by reducing racking, labour, and land area, which lifts effective project IRR even when the cell itself is unchanged [S5]. Tandem and perovskite-on-TOPCon stacks are flagged in the supply-chain press as the next cost inflection, with commercial production expected in 2027-2028 and 720 W-class modules anticipated by 2028 on the same form factor [S9].
Total cost of ownership across a 25-30 year field life

Cell cash cost is only one of three TCO blocks; the other two are field degradation and operating-energy yield. TOPCon's first-year degradation under 1% and a 30-year output floor of 87.40%, paired with a -0.30%/°C temperature coefficient, compresses the LCOE gap to PERC even when the cell itself is more expensive to print [S3][S4]. A buyer running a hot-climate utility-scale project should weight temperature coefficient hard: a 0.05%/°C advantage compounds into several percent of annual yield over a 25-year asset life, more than enough to absorb a small cell-cost premium.
Operationally, the move from PERC to TOPCon changes maintenance only marginally, because the front-end cleaning, texturing, and diffusion steps are shared, and the new rear-side deposition step is a closed reactor with low scheduled-downtime. The largest TCO surprise for new TOPCon lines is the in-line metrology bill: ellipsometry on the 1-2 nm tunnel oxide and sheet-resistance mapping on the poly-Si layer need frequent calibration, and skipping them shows up as yield loss, not as a cell-cost line [S7].
Standards, sourcing, and a 2026 buyer checklist
No single IEC standard governs TOPCon cell cost or yield directly, but a 2026 buyer's sourcing checklist should include IEC 61215 and IEC 61730 for the module-level qualification, ISO 9001 for cell-level process control, and a verified field-degradation dataset from the cell vendor covering at least 12 months of outdoor exposure in a climate tier similar to the project site [S4][S7]. For buyers comparing Chinese and Indian cell suppliers specifically, the public 2026 datasheets already publish the figures a TCO model needs, including Voc, Isc, Pmax at STC and NOCT, and a cell-efficiency accuracy window of ±0.10% (for example, Emmvee's published front efficiency above 25.00% with a bifacial rate of 80.00% ± 5.00%) [S2][S5].
Process-engineering buyers should cross-check the deposition architecture (PECVD, LPCVD, or PEALD) and the in-situ versus ex-situ doping choice against the target efficiency bin, because the same nominal "25% TOPCon" cell can hide a 0.3-0.5% absolute efficiency spread that maps directly into $/W [S7]. A related engineering reference, TOPCon process control on tunnel oxide, LPCVD, and ALD passivation, walks through those same deposition gates in more depth. For buyers also specifying the cover glass, the 2026 solar-glass spec map sits one layer up the BOM and influences module LCOE almost as much as the cell itself.
Trackable signals for the next 6-12 months: copper-plating share of TOPCon silver-displacement lines (rising from low single digits toward 20-30% would shift cell cash cost by 5-10%); the first commercial shipments of n-type wafers at 110 μm or below; and any disclosure from Tier-1 cell vendors on perovskite-on-TOPCon pilot line run-rate, since that is the most credible lead indicator for the 2027-2028 tandem transition flagged in current industry press [S7][S9].
For the relevant spec sheets and selection criteria, see additive manufacturing material, load cell, and load cell module.