
Market Scale and Upstream Share
The global oil and gas capex market was estimated at $680.9 billion for 2026 and projected to reach $708.5 billion in 2027 and $850.5 billion by 2032, implying a 3.72% compound annual growth rate from 2027 to 2032 [S3].
The overall oil and gas CAPEX market was forecast to grow at a 3.72% CAGR from 2027 through 2032. Asia Pacific was identified as the largest and fastest-growing regional oil and gas CAPEX market.
Asia Pacific was identified as the largest and fastest-growing regional oil and gas CAPEX market.
Why Spending Growth Is Selective
Wood Mackenzie expected a second consecutive year of slight decline in global upstream development spending in 2026, with capital constraints preventing an unrestricted response to commodity prices [S1]. This differs from the broader market forecast, which projects aggregate oil and gas capex growth after 2026, reflecting the distinction between constrained upstream project approval and wider infrastructure, maintenance and decommissioning demand [S1][S3].
Deloitte framed the 2026 environment as a combination of shifting policies, rising costs, digital change, LNG growth and long-term resilience requirements [S2]. The result is not a uniform spending cycle: projects tied to sanctioned LNG trains and producing-field compression are more bankable than options dependent on an uncommitted sanctioning decision [S3].
Regional and Asset Comparison
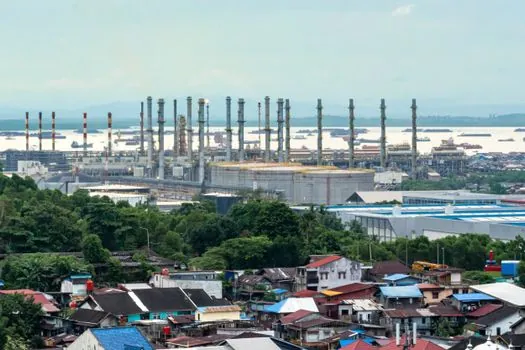
LNG-ready infrastructure ranks differently from conventional upstream work. LNG capacity additions create demand across processing, storage and marine interfaces, with Offshore projects combine the segment’s 6.85% growth forecast with long-cycle sanctioning exposure, while onshore spending already holds 78.82% of the market [S3].
Priority Project Types
Brownfield compression and electrification form one of the clearest order paths because they support existing production while reducing emissions intensity.
Deep-water discoveries can support later final investment decisions, but the timing remains long.
For equipment and service suppliers, exposure to named trains and brownfield work offers clearer order visibility than generic participation in a future sanctioning cycle [S3].
Who Benefits and Who Does Not
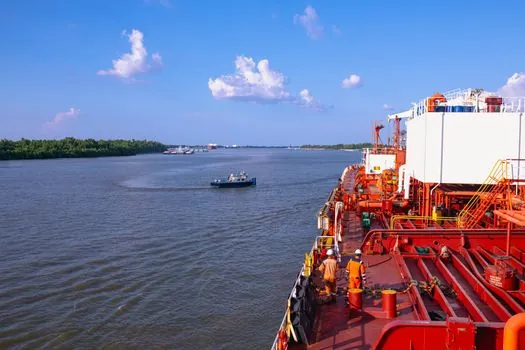
Suppliers serving sanctioned LNG processing, storage and marine packages fit the 2026 spending pattern because their order pipeline depends on committed projects [S3].
The weaker fit is for suppliers dependent on uncommitted greenfield projects or a rapid return of operator spending. Oil-price uncertainty, skilled-labor constraints and selective financing can delay conversion of project potential into committed capital [S3]. Such suppliers should track sanctions and final investment decisions rather than treat oil-price strength alone as an order signal.
Gas detection, sealing and rotating-equipment suppliers can still address both production and brownfield packages, but the relevant equipment class must match the actual project interface. For fluid-containment systems, an oil seal addresses shaft sealing, while a mechanical seal is a pressure-balanced sealing arrangement; neither should be treated as a universal substitute across API 6D, pumping and compressor applications.
Cost, Execution and Supply Risks
Rising costs are one of the three operating pressures shaping the 2026 outlook, alongside policy shifts and digital change [S2]. In equipment selection, lifecycle cost, compatibility and supplier execution capacity therefore matter more than headline upstream spending growth [S2][S3].
Skilled-labor constraints can prevent a technically attractive project from reaching sanction, while selective financing can delay equipment orders even after development concepts mature [S3]. LNG projects also impose coordination requirements across processing, storage and marine interfaces, increasing the value of vendors able to manage engineering interfaces across the asset program [S3].
Brownfield upgrades present a different risk profile from greenfield construction. Work must coexist with producing assets, making outage planning, interface management and deliverable documentation central to schedule control [S3]. Offshore growth of 6.85% from 2027 to 2032 also does not remove long-term exposure associated with multi-year developments [S3].
Supplier Strategy and 2026 Signals
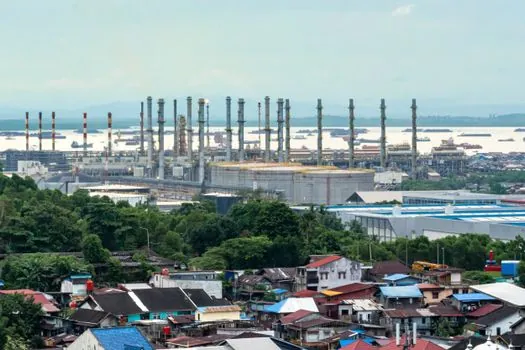
A disciplined 2026 market rewards suppliers aligned with committed work: LNG processing and marine packages, production-supporting compression, brownfield electrification, construction, maintenance and decommissioning [S1][S3]. The strongest available signals are project-specific, including final investment decisions, sanctioned train schedules, offshore awards, brownfield shutdown schedules and actual purchase-order releases [S3].
For procurement teams, track four measurable items through 2026: the $680.9 billion market baseline, the $708.5 billion 2027 estimate, the 73.27% upstream share and the 6.85% offshore growth forecast [S3]. These figures should be treated as planning baselines rather than guaranteed supplier revenue, because sanction timing, commodity prices, financing and labor availability determine project conversion [S1][S3][S5].