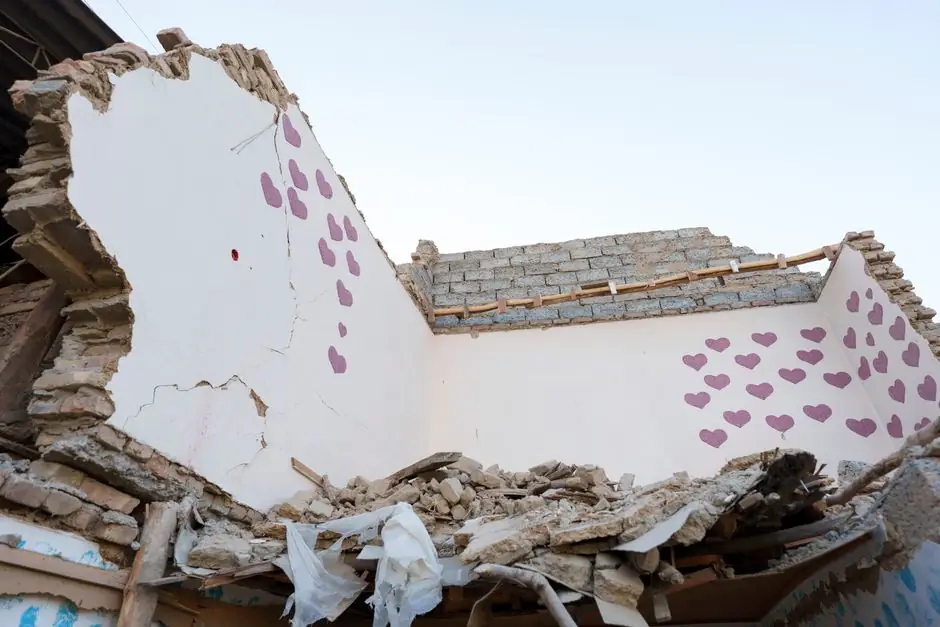
U.S. construction material prices rose 2.6% in May 2026 on a monthly basis and were up nearly 10% year over year, per ABC data released 11 June 2026 [S4].
The acceleration came on the heels of an even sharper April reading: residential building materials excluding energy climbed 3.7% in a single month, the fastest monthly pace in three years, per the National Association of Home Builders on 14 May 2026 [S6]. The same two-track pattern shows up in the California Construction Cost Index, where the 2026 reading moved from 10,124 in March to 10,633 in August, based on ENR San Francisco and Los Angeles BCI inputs [S1].
ENR-Based State Index: California CCCI Monthly Path
The California Construction Cost Index, derived from the ENR Building Cost Index average for San Francisco and Los Angeles, opened 2026 at 10,159 in January, dipped to 10,124 in March, then accelerated: 10,188 in May, 10,396 in June, 10,548 in July, 10,633 in August, and 10,717 in September [S1]. That September value already exceeds the December 2025 close of 10,258 by 4.5%, with three reporting months still outstanding in the calendar year. For comparison, the full-year 2025 annual change logged 3.9% on the same index, and 2024 logged 2.3%, so the 2026 trajectory is running well above both prior-year benchmarks [S1].
Procurement teams working off CCCI should treat the 4.5% September-over-December 2025 figure as a hard floor for any 2027 forward-pricing model until the October, November, and December CCCI values print. The series is published by the California Department of General Services with the current month updated in the second half of the following month.
National Nonresidential Cost Index: Mortenson Q1/Q2 2026
The Mortenson Construction Cost Index, which prices a representative non-residential project basket across eight U.S. cities, rose 1.58% quarter over quarter in Q1 2026 and 5.6% over the trailing twelve months [S5]. Salt Lake City led the city breakdown at 7.87% year over year, followed by Denver at 6.84%, Minneapolis at 6.66%, Phoenix at 6.32%, Milwaukee at 6.22%, Chicago at 5.39%, Seattle at 3.48%, and Portland at 3.19% [S5]. Single-quarter moves ranged from 0.6% in Milwaukee to 2.86% in Minneapolis, a spread that captures how union labor settlements, mega-project electrical demand, and tariff exposure can hit one market harder than another in a given quarter.
The index is driven by three named pressure points: previously negotiated union agreements feeding into labor cost lines, mega-project demand stressing electrical and skilled-trade capacity, and tariff, energy, and geopolitical disruption flowing into materials and freight [S5]. For spec writers, the relevant takeaway is that 5.6% is a national blended number; project-level escalation clauses should be calibrated to the city-specific 12-month print, not the headline.
Producer Price Series Worth Tracking on FRED
The St. Louis Fed FRED database carries the canonical U.S. construction cost series. The Producer Price Index by Commodity: Special Indexes: Construction Materials (series WPUSI012011, base 1982=100) is published monthly, not seasonally adjusted, with the latest vintage covering January 1947 through August 2026 as of the 10 September 2026 release [S3]. Sister series on the same release schedule include PPI for New Industrial Building Construction (PCU236211236211), PPI for Construction Sand and Gravel Mining (PCU2123212123210), and PPI Inputs to Residential Construction, Goods (WPUIP2311001, base Jun 1986=100) [S3].
For labor-side modeling, the Employment Cost Index for Wages and Salaries: Private Industry Workers: Construction (ECICONWAG, base Dec 2005=100) runs quarterly with Q1 2001 through Q2 2026 published 31 July 2026 [S3]. Pairing that quarterly labor series against the monthly PPI inputs gives a two-axis view: materials versus labor, with labor lagging by one quarter. Equipment-side cost is captured by PPI Construction Equipment Rental and Leasing (PCU5324125324121) and PPI Parts for Construction Machinery (PCU3331203331209), both also current through August 2026 [S3].
Cross-Index Comparison: 2026 Annualized Pace
Three independent measures converge on a 4.5% to 10% annualized cost-inflation band for 2026, depending on the slice. The ENR-based California CCCI is up 4.5% year to date through September against December 2025 [S1]. The Mortenson national nonresidential index prints 5.6% trailing twelve months as of Q1 2026 [S5]. The ABC national materials index is up nearly 10% year over year as of May 2026 [S4]. The NAHB residential ex-energy index jumped 3.7% in a single month (April 2026) [S6].
Selection rule for the buyer: use CCCI or a state-ENR index for West Coast public works bids because it tracks SF and LA labor and materials, use Mortenson for private nonresidential cost planning in the eight covered cities, use ABC for wholesale materials benchmarking, and use NAHB for residential wood-and-composite framing packages. For volume-adjusted context, U.S. real construction put-in-place in 2026 is expected to be down 1.7% after inflation [S2], which means nominal dollar growth and real volume growth are decoupling, a signal that estimators should hold contingency reserves on the higher end of any historic band.
Failure Modes and Specification Pitfalls

Two predictable failure modes show up when indices outrun estimates. First, fixed-price contracts signed against Q4 2025 unit costs will compress margin on any delivery slip past Q2 2026 because the CCCI, ABC, and NAHB indices all accelerated in the April to June 2026 window [S1][S4][S6]. Second, single-index escalation clauses, for example a contract tied only to ENR BCI without a labor carve-out, will not capture the quarterly labor step-ups visible in the Mortenson city breakdowns where Minneapolis moved 2.86% in a single quarter [S5]. Spec writers should pair a materials index (ABC or BLS PPI series WPUSI012011) with a labor index (ECICONWAG or the applicable local union wage schedule) and weight them to the project's actual material-versus-labor ratio [S3][S5].
For resin-intensive scopes the relevant index is petrochemical feedstock cost, not the headline construction basket, and the same logic applies to copper and aluminum-heavy mechanical and electrical packages where the copper material line tracks LME rather than ENR. A clean specification names the index, the base month, the source publisher, and the revision frequency, with ENR BCI, BLS PPI WPUSI012011, and ABC all publishing on different lags [S3][S4].
Trackable Signals for Q4 2026
Three signals are worth watching in the remaining 2026 reporting window. First, the October, November, and December CCCI values from the California DGS, which will set the official full-year 2026 annual percentage and indicate whether the September 10,717 reading continues to climb or plateaus [S1]. Second, the BLS PPI release on or around 10 October 2026, which will publish September PPI for Construction Materials (WPUSI012011) and the related construction-inputs series [S3]. Third, the Turner Building Cost Index Q3 2026 publication, which is already flagged in the Turner cost-index feed as showing high-growth sectors driving the index higher [S9].
Mortenson's Q3 2026 city breakdown, expected late October, will refresh the 5.6% national twelve-month figure with a new quarterly delta; the published drivers (union agreements, mega-project demand, tariff and energy exposure) remain the same three levers that drove the Q1 print [S5]. For crane and hoist planning on projects bidding in this window, the PPI Construction Equipment Rental and Leasing series is the cleaner escalation reference than a general materials basket [S3].
Component reference pages worth checking: construction tools, and construction machinery and equipment.