The 2026 power generation market is reported by The Business Research Company as a multi-source, multi-grid-type stack — hydroelectricity, fossil fuel, nuclear, solar, wind, geothermal, biomass and "other types" — split further into off-grid versus on-grid delivery architectures [S4]. That taxonomy is the only clean way to read the next decade of capex, because the per-MW hardware mix (transformer MVA rating, power cable cross-section, switchgear short-circuit level) changes with each source.
Adjacent inputs already show the upstream squeeze. Power cable demand was valued at USD 148.6 B in 2021 and is forecast to reach USD 277.8 B by 2031 at a 6.4% CAGR for 2022–2031, per Allied Market Research [S5]. Magnesium metal — a structural input for transformer tank enclosures and aluminium alloy conductors — sits at USD 6.85 B in 2026 with a 10.0% CAGR to USD 13.33 B by 2033, with die-casting holding 37% of the 2026 application share [S3]. Specifying engineers should assume conductor, tank and busbar material costs drift with that magnesium curve for the next 24 months.
2026 Generation Stack by Source and Grid Type
The 2026 generation report frames the market by source first (hydroelectricity, fossil fuel electricity, nuclear electricity, solar, wind, geothermal, biomass, other types) and then by grid type — off-grid versus on-grid — as the second decision layer [S4]. The on-grid column is the larger line item in nearly every regional dataset, but off-grid solar-plus-storage is the fastest-growing cell, driven by remote mining, island microgrids, and data-centre edge builds. Specifiers buying power transformers for these projects should not assume a single MVA class covers both: on-grid interconnect units are sized by G99 / IEEE 1547 short-circuit and flicker studies, while off-grid units are sized by load step, inrush and harmonic content of the local inverter cluster.
The same source split drives cable cross-section selection. A 50 MW solar farm ties to the substation with 630 mm² or larger single-core aluminium or copper conductors in trefoil, with screen standing voltage ratings chosen for the collector-ring length. A biomass or geothermal unit, by contrast, often uses shorter MV runs and may specify 11 kV or 33 kV XLPE rather than 66 kV+ — the cable bill scales with the source, not just the MW rating. For an honest read of capex, the per-source MW pipeline must be multiplied by the correct per-MW transformer-and-cable factor, not by an industry average.
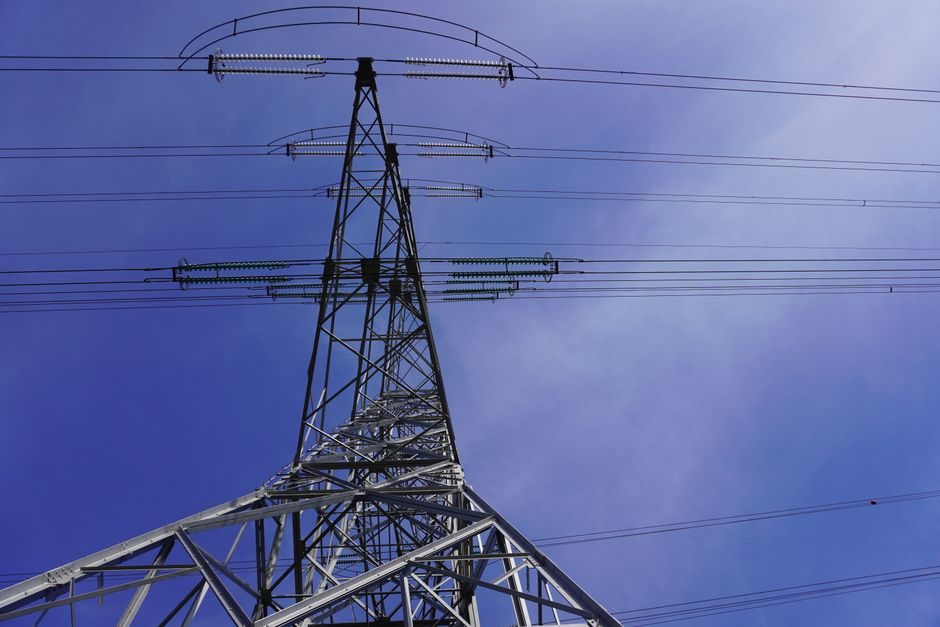
Hardware Bands: Transformer Core, Conductor and Cable Volumes
Transformer volumes are coupled to generation additions through MVA-per-MW ratios that vary roughly 0.6–1.1 for utility step-up, with industrial step-down at 1.0–1.4 and distribution often higher. Engineers sizing 2026 orders should treat 100 MVA, 132/33 kV, ONAN/ONAF oil-immersed units as the workhorse class for on-grid solar and wind interconnect, with CRGO silicon-steel core losses typically specified in the 1.6–2.0 W/kg range at 1.7 T. For a deeper look at how core material, oil choice and MVA band interact, the 2026 transformer spec overview covers the same 2026 vintage in detail transformer spec bands, oil choices and forecast windows. [S1]
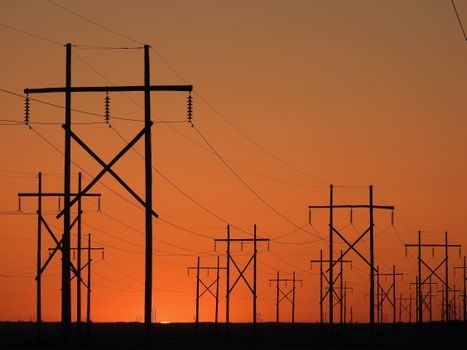
Cable volumes scale with circuit-km per MW, which drops as voltage rises. A useful sanity check: at 132 kV a 100 MW circuit is typically one three-core or three single-core cable per phase; at 33 kV the same power needs roughly four parallel circuits, each with proportionally larger copper. The USD 148.6 B 2021 to USD 277.8 B 2031 power cable trajectory at 6.4% CAGR [S5] is therefore not just "more cable" but a higher voltage-weighted mix as renewable interconnect climbs. The same Allied Market Research report on the power cable segment confirms 2031 as the report horizon, with Himanshu Jangra, Lead Analyst for Semiconductor and Electronics, framing the demand driver as grid expansion and renewable tie-ins.
Off-Grid vs On-Grid: Who Each Architecture Is For
On-grid architectures serve utility-scale generation connected to a transmission or distribution network, with revenue tied to a power purchase agreement and dispatch governed by the system operator. Off-grid architectures serve isolated loads — remote mining, islands, military sites, and increasingly behind-the-meter data-centre campuses — where generation and load are co-sited and the network operator is absent or optional. The 2026 report keeps the two as a binary "Type of Grid" split [S4], but in practice the specifier decision is four-axis: load profile (continuous vs cyclic), distance to nearest grid, fuel logistics, and regulatory export rules.
For continuous industrial loads near a grid, on-grid wins on capex per MW and on harmonics control, because the grid absorbs the reactive and harmonic burden that an islanded inverter cluster must handle locally. For cyclic or remote loads, off-grid wins on transmission losses and on the avoided cost of a grid connection that may run 10–80 km. The hardware implications are concrete: on-grid power transformers need tap-changers coordinated with system voltage, while off-grid units need overload capability sized to the largest single motor or inrush event, often at 1.5–2× nameplate for several seconds.
Selection Criteria: Matching Source, Voltage and Cable to the Load
A defensible 2026 spec starts with four numeric gates: nameplate MW, distance to substation, grid voltage at the point of common coupling, and the target annual energy yield. From those, the specifier derives the step-up transformer MVA, the MV cable cross-section, and the SCADA / protection class. The cable class follows directly from current (A) = MW × 1000 / (√3 × kV × power factor × 0.95 derating), derated for soil thermal resistivity, burial depth, grouping, and ambient. Selecting conductor material — copper vs aluminium — then depends on conductor price spread, weight limits on long runs, and jointing labour. [S2]
For a comparison snapshot, the table below lines up the three dominant 2026 grid hardware families against the four criteria that most often drive the order.
Power cable (MV/HV XLPE) wins on routability and on the widest installer base, but loses on transmission distance above ~80 km without series compensation. Power transformer (oil-immersed) wins on MVA-per-dollar for anything above 5 MVA, but loses on fire-protection footprint in indoor substations — dry-type or ester-filled units then take over, at a 1.4–1.8× cost premium. Switchgear (MV AIS or GIS) is the gating item on short-circuit level; AIS is 30–50% cheaper up to 36 kV, GIS dominates above 72.5 kV on footprint grounds.
Standards and Compliance Anchors for 2026 Specs
Grounding a 2026 spec to standards rather than to vendor literature is the cheapest insurance against rework. Power transformer dielectric and short-circuit behaviour is governed by IEC 60076, with load and temperature limits under IEC 60076-7 and tap-changer performance under IEC 60214. Power cables are typically specified to IEC 60502-2 for MV and IEC 60840 / 62067 for HV and EHV, with current ratings checked against IEC 60287 and the soil / grouping derating of IEC 60287-2-1. Switchgear short-circuit and continuity of service falls under IEC 62271-100 for circuit-breakers, with type and routine tests under IEC 62271-200 for metal-enclosed assemblies. [S3]
For grid-connected generation, IEEE 1547 and the regional equivalents (G99 in the UK, VDE-AR-N 4110 in Germany, AS/NZS 4777.2 in Australia) set the interconnect behaviour that the protection relay must implement. The 2026 generation report's on-grid / off-grid split [S4] maps cleanly onto these documents: on-grid units are tested against the standard's grid-support functions (Volt-Var, Freq-Watt, ride-through), while off-grid units are tested against the local load's power-quality envelope. Verifying that the protection relay firmware revision matches the applicable interconnect revision is a routine gate that the 2026 specifier should keep on the punch list.
Limitations, Failure Modes and What the 2026 Forecast Cannot Resolve
Market-size reports at the report-card level — "USD X billion by year Y at Z% CAGR" — do not resolve four decisions the specifier still owns. Second, they do not tell you the voltage-weighted split; a 50% jump in cable revenue can come from 20% more km at constant spec, or 5% more km at higher voltage with longer delivery lead times. Third, they do not tell you the supply-chain tightness on CRGO steel, copper rod, or XLPE compound — each of which has moved 15–40% within the last 12 months in separate cycles. Fourth, they do not resolve the magnesium / aluminium input tension: with magnesium die-casting at 37% of the 2026 magnesium application share [S3], any sustained pressure on magnesium supply feeds back into transformer tank and aluminium-alloy conductor pricing.
The practical failure mode is treating a single CAGR as a deliverable. A 6.4% cable CAGR [S5] over 2022–2031 looks attractive until the specifier realises that 132 kV submarine cable slots are booked 24–36 months out and that the bottleneck is factory throughput, not market demand. The mitigations are familiar: dual-source long-lead items by 2026 Q4, write the cable spec to allow an equivalent cross-section (e.g. 1000 mm² aluminium in place of 630 mm² copper with adjusted ducts), and hold the transformer impedance band as a window (8–12%) rather than a single number so that alternate factories can bid.
Two signals to track through the second half of 2026: the published 2026 capex guidance from the major Chinese cable mills and transformer makers, which sets the floor on the Asia-Pacific hardware price; and the EU TYNDP / US DOE annual grid-resilience releases, which set the ceiling on the Western utility capex envelope. Either can shift the per-MW hardware factor by a low double-digit percentage, which is the band that actually drives an order decision, well before the headline market-size number moves.
For component-level specifications, see power meter.