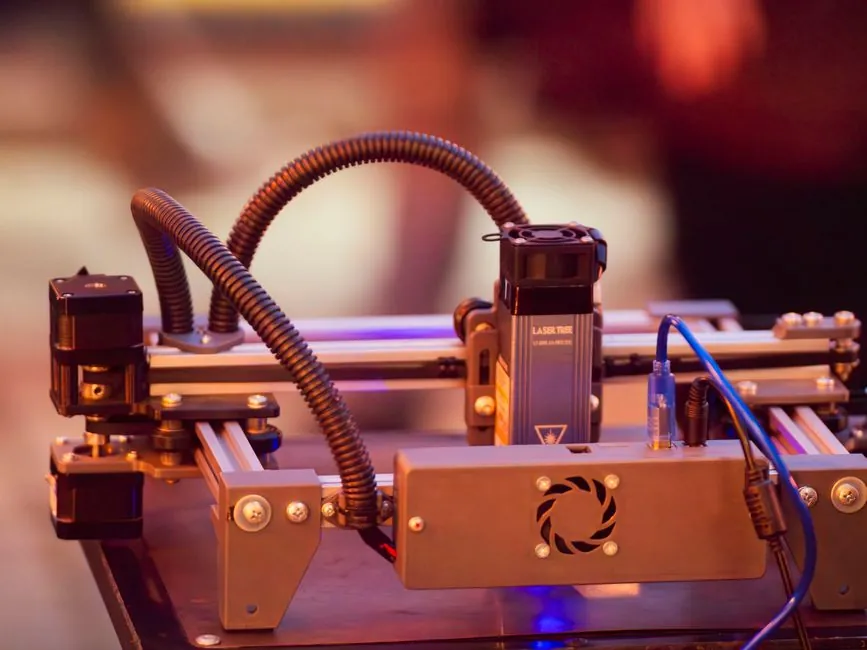
Powder-bed fusion systems in 2026 keep cost per part down by reclaiming and refreshing unused metal powder, a structural shift away from one-shot material consumption that defined the 2018–2023 cost curve [S4]. Multi-laser SLM/DMLS platforms, AI closed-loop monitoring, and automated nesting have collectively moved additive manufacturing past the prototyping-only economics that constrained it through 2022 [S4].
Desktop FDM units that retailed near $2,000 in 2020 now sell for $250–400 in 2026, printing at 300–500 mm/s with multi-color capability, per the JLC3DP and MakeQuote market readouts [S5]. On the industrial side, the global additive manufacturing market sits at an estimated $28–34 billion for 2026, with hardware at $9–11 billion, materials at $5–6 billion, software and services at $7–9 billion, and print services at $7–8 billion [S5]. Comparable forecasts put 2026 revenue at $28.55 billion (Fortune Business Insights) and $34.85 billion (Precedence Research), confirming the consensus band [S2][S3].
What Drives Cost Per Part Across the 2026 Technology Stack
Five variables set the 2026 cost-per-part baseline: machine depreciation per build hour, material yield (powder reuse ratio for metals, support and infill waste for polymers), build time per part, post-processing labor, and certification overhead for regulated verticals [S4]. Multi-laser SLM/DMLS systems raise build speed and production throughput, AI monitoring adjusts laser power in real time to cut failure rates, and automated nesting increases pack density on the build plate, all of which compress cost per part without changing the printer list price [S4]. Precedence Research puts hardware at more than 65% of 2025 revenue and metal materials at over 53%, signaling where the unit economics still concentrate [S3].
Materialise frames 2026 around the shift from innovation to application, emphasizing that AM now scales through partnership dynamics between in-house engineering and external service bureau expertise rather than through isolated machine purchases [S1]. That shift matters for cost: a part that costs $X on a captive system at 40% utilization may cost far less on a bureau running the same platform at 80% utilization, since fixed depreciation and labor are amortized across more build hours.
Cost Per Part by Technology: A 2026 Comparison
The table below ranks the dominant 2026 production technologies against four buyer-facing criteria. The hardware-cost column uses the consensus 2026 price band; the material-cost column reflects powder reuse and reclaim capability rather than virgin material price alone. [S4]
Desktop FDM (sub-$400 machines, PLA/PETG/TPU) is the lowest absolute cost-per-part option for prototypes, jigs, and short-run consumer goods, but it offers no metal capability, limited engineering-grade polymer options, and surface finish that usually requires sanding or vapor smoothing [S5]. Industrial FDM with PEEK and PEKK pushes material cost per kilogram an order of magnitude higher than commodity PLA, but it serves aerospace and oil/gas applications where CNC lead time or buy-to-fly ratio would be worse [S5].
Binder jetting for metals competes with SLM/DMLS on throughput because the entire build volume is printed in a single pass rather than fused trace-by-trace, but it requires a separate infiltration or sintering furnace and a controlled-atmosphere debind step, adding fixed cost outside the printer itself [S5]. SLM/DMLS with multi-laser systems and powder reuse remains the reference process for aerospace structural parts and medical implants, with cost per part dominated by powder, build time, and post-processing HIP (hot isostatic pressing) or machining of critical interfaces [S4][S5]. Stereolithography (SLA) and other resin systems generated more than 11% of 2025 technology revenue, holding the cast-pattern and dental-mold niches where surface finish and accuracy outweigh raw material cost [S3].
Volume Tier and Total Cost of Ownership in 2026

Cost per part is not a single number; it is a curve that bends sharply at three breakpoints. Below 10 parts, desktop FDM and SLA bureaus win on amortization and zero setup overhead. Between 10 and 500 parts, industrial FDM in PEEK/PEKK or short-run SLM/DMLS takes the lead, especially for parts with internal channels or topology-optimized geometry that would be unmachinable [S4]. Above 500 parts, injection molding or CNC generally reclaims the cost advantage, except where part consolidation, lightweight lattice structures, or patient-specific medical geometry keep AM competitive past 10,000 parts per SKU [S4][S5].
Total cost of ownership in 2026 includes more than the printer and powder. Post-processing labor historically extended production time and cost by 20–40% of build time, and 2026 gains in automated depowdering, CNC interface machining, and batch HIP have trimmed that overhead, but they have not eliminated it [S4]. For buyers specifying AM, the realistic cost-per-part model should add machine depreciation per build hour, powder cost net of reuse ratio, support material and waste, post-processing labor, QA and CT scanning for safety-critical parts, and certification overhead for aerospace (AS9100) and medical (ISO 13485) work [S4][S3].
Where the 2026 Cost Curve Is Still Bending
Powder reuse and material optimization have lowered consumable costs on metal systems to the point that powder is no longer the dominant line item on a per-part basis, with build time and post-processing now taking larger shares [S4]. Localized manufacturing networks and on-demand print farms are shortening logistics lead time, which matters for spare parts and field service where downtime cost dwarfs the part price [S4][S5]. The 2026 market data shows print services at $7–8 billion, larger than the materials segment, which is the clearest signal that bureau capacity, not captive machine ownership, is the cost lever most buyers are pulling [S5].
For spec-driven buyers cross-referencing AM against traditional processes, the 316 stainless steel wire price band for 2026 and the 303 vs 316 stainless key stock trade-offs are useful priors when choosing between machining a billet and printing in 17-4PH or 316L powder. Likewise, AM cost discussions intersect with GPU supply and demand in 2026 wherever AI-driven build simulation and computer-vision QA enter the procurement equation.
Limitations and What the 2026 Data Does Not Yet Show
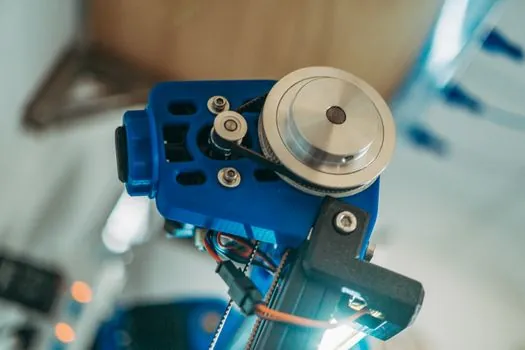
Public 2026 cost-per-part data is still technology- and material-aggregated rather than per-vendor, and buyers comparing specific SLM/DMLS platforms should request vendor-specific build time and powder reuse ratio data before committing to a multi-year service bureau contract [S4]. Failure rates on metal systems have dropped with closed-loop monitoring, but they have not hit zero, and the cost model must still carry a scrap and rework allowance for production runs above 100 parts [S4]. The shift to generative design and AI-optimized topology, covered in the Precedence Research coverage of generative design tools, can cut material usage, but it adds an engineering cost that is rarely captured in online quoting tools [S3].
Trackable signals for the next six months: a 2026 H2 update on the desktop FDM sub-$300 price floor, a vendor disclosure of multi-laser SLM build rates at 4-laser and 8-laser configurations, and any public revision of the 17.96% to 21.60% CAGR band as Fortune Business Insights and Precedence Research reconcile their 2026 baselines [S2][S3]. Buyers should also watch the industrial valve and flow meter supply chains, where on-demand AM spare parts are starting to displace warehouse inventory for low-volume SKUs, since that is a leading indicator of how quickly bureau cost-per-part will compress for short-run industrial components.
Spec-level background on the components involved: 3d scanner.