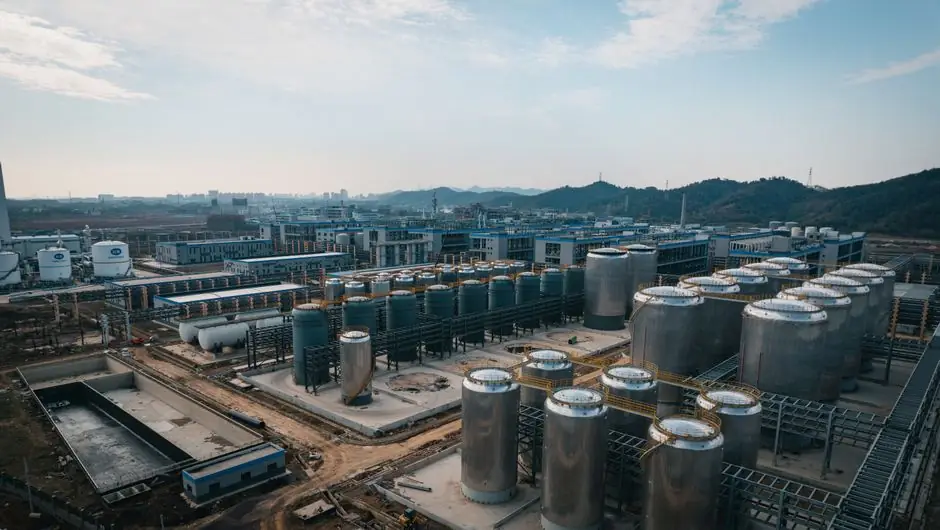
A 10,000 to 20,000 MT per year activated carbon plant is the canonical greenfield scale for coconut shell, coal, or wood feedstock, balancing throughput against raw material logistics and utility availability [S3].
Activated carbon itself is a porous, high surface area adsorbent produced by carbonising and then activating biomass, coal, or peat, with end uses spanning water treatment, air purification, gold recovery, and pharmaceutical processing [S7]. Demand has become regulatory-driven as PFAS, microplastics, and tightening VOC limits mandate granular activated carbon (GAC) treatment across municipal and industrial sites [S5].
Capacity Sizing and Plant Economics
IMARC Group's 2026 detailed project report sizes a greenfield plant at 10,000 to 20,000 MT per year, with a gross profit band of 35 to 45% and a net profit band of 15 to 20% under normal operating conditions [S3]. The same report puts raw materials at 50 to 60% of total operating expense and utilities at 25 to 30%, making coconut shell supply contracts the single most important commercial variable for any investor [S3]. Beyond the canonical 10,000 to 20,000 MT band, small-scale units under 1,000 MT per year are viable for regional or specialty grade production, particularly for powdered activated carbon sold into pharmaceutical decolorisation [S8].
Process flow is identical regardless of scale: carbonisation in oxygen-limited kilns, activation by steam or chemical agent, cooling, grinding, screening, washing, drying, and packaging [S4]. The activation method is the most consequential unit operation, since it sets the surface area, pore size distribution, and ultimately the selling price per MT of finished carbon [S6].
Raw Material, Activation, and Process Trade-offs
Coconut shell activated carbon is preferred for gold recovery and potable water because it yields a hard, high microporosity granule; coal and wood activated carbon serve larger-volume air and industrial liquid treatment, while peat and bamboo sit in between on hardness and pore structure [S7][S4]. A 2025 PMC life cycle assessment compared KOH and NaOH chemical activation on coconut shell feedstock and found that KOH carries materially higher embodied energy and CO2 per kilogram of finished AC, because KOH is produced by electrolysis of KCl and is more energy intensive than NaOH manufacture [S1]. Steam activation on the same feedstock has been reported at 5.68 kg CO2 and 34.4 MJ cumulative energy demand per kg of finished AC, with AC production itself representing about 60% of the supercapacitor electrode life cycle impact [S1].
For gas-phase activated carbon, hard-coal-based GAC routes documented in the 2022 Vilén LCA use electricity, natural gas, water, and hard coal as the principal inputs, with coal pyrolysed and then steam activated to develop the pore structure [S2]. Selection between coconut shell, coal, and wood therefore locks in both the supply chain geography and the activation energy intensity of the plant, and should be set before the kiln and boiler train are specified [S4].
Who a 10,000 to 20,000 MT Plant Is For, and Who It Is Not
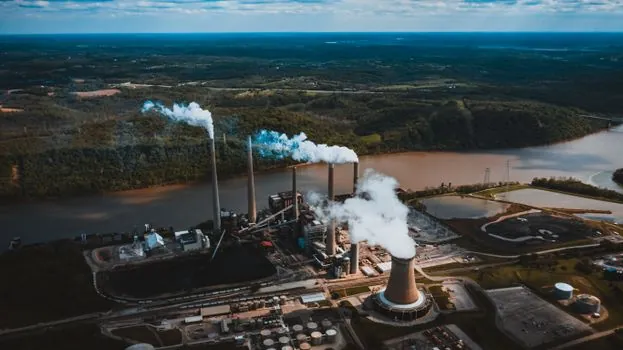
This capacity band suits new entrants targeting export-grade coconut shell carbon, established Indian or Southeast Asian producers adding a second line, and EPC-backed industrial chemical groups seeking a captive supply for captive water or air treatment [S5][S3]. It is poorly suited to toll manufacturers needing flexible small batches, or to projects without a secured coconut shell supply within roughly 150 km of the plant, because raw material logistics and seasonality will dominate landed cost [S3].
The same report flags that a 50 to 60% raw material share of OpEx means that any project without a multi-year offtake or backward integration into a coconut processing cluster is exposed to feedstock price shocks [S3]. Investors should also screen the site against the canonical 10,000 to 20,000 MT scale only if land, water, and grid power can absorb the corresponding utility draw, since activation kilns and steam boilers dominate the load profile [S4].
Comparison: Coconut Shell vs Coal vs Wood Activated Carbon
Across the four main feedstock options, the decision matrix is fairly stable. Coconut shell activated carbon delivers the highest microporosity and hardest granule, so it is the default for gold recovery CIP/CIL circuits and for premium potable water grades, but it depends on tropical coconut supply [S5][S7]. Coal-based GAC, as documented in the Vilén comparative LCA, has lower feedstock cost per MT in coal-producing regions and dominates municipal and industrial air treatment, with electricity, natural gas, water, and hard coal as the four main process inputs [S2]. Wood activated carbon is softer, more macroporous, and cheaper in temperate regions, making it the standard for liquid-phase decolorisation in food and pharma [S7]. Peat and bamboo activated carbon sit between wood and coal on hardness and cost, and are typically chosen where local agriculture or forestry policy requires a domestic biomass sink [S6][S4].
On environmental performance, a 2022 comparative LCA of CS-based AC production in Indonesia reported that switching process energy to biomass could cut human toxicity by up to 60% and global warming by up to 80% versus fossil-fired kilns, and that CS AC generally has the lowest environmental impact across multiple impact categories when compared with coal, wood, peat, and reactivated coal AC [S1]. That same comparative set found that AC from CS does carry higher climate change, acidification, and fossil fuel consumption impacts than AC from palm oil shells in some studies, so the choice should be cross-checked against the regional grid carbon intensity and the local biomass mix rather than read off a single number [S1].
Equipment, Instrumentation, and Utility Footprint
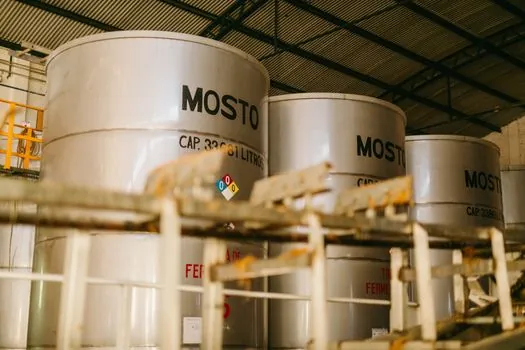
The canonical plant train needs carbonisation kilns (typically rotary or fluidised bed), steam activation furnaces, cooling drums, crushers, vibratory screener, washing tanks, and a dryer, all sequenced through a bagging and palletising line [S4]. Process control should be built around temperature, CO and O2 trim on the activation furnace, and steam-to-carbon ratio, since drift on any of these directly degrades iodine number and hardness, the two spec parameters most buyers will test [S4].
For solid, liquid, and gas flow measurement, a modern activated carbon plant will specify a pressure transmitter on each steam header and reactor jacket, an industrial valve train on every acid, caustic, and condensate line, and a flow meter on the kiln combustion air and on the finished carbon conveyor weigh scale, with instrument air regulated through a pressure sensor manifold [S4]. Plant engineering for the structural and process piping side should follow the same spec discipline used in any carbon steel process skid, with material certificates traceable to the kiln service temperature and the acid wash section [S4]. Where hot-oil or burner management is involved, carbon fiber based insulation blankets on the kiln shell are now specified to drop skin temperature and reduce standby losses on cyclic duty [S1].
Limitations, Failure Modes, and Sourcing Risk
The most common failure mode on a new plant is under-sized dust collection and wet scrubber capacity, which forces the activation furnace below its design residence time and pulls iodine number below buyer spec [S4]. A second recurring failure is single-source coconut shell supply, since the 50 to 60% raw material share of OpEx amplifies any seasonal deficit directly into gross margin [S3]. On the demand side, regulatory-driven buyers (US EPA PFAS rules, EU drinking water directives, China's Blue Sky Action Plan, India's Clean Ganga Mission) are generally stable, but specialty buyers (gold CIP/CIL, pharmaceutical decolorisation) follow gold price and pharma capex cycles, so a plant with more than 40% of revenue in one specialty channel is exposed [S5].
For sourcing discipline, treat the activation furnace, the steam boiler, and the bagging line as long-lead items, and pre-qualify at least two vendors for each before the DPR is signed, since delivery windows of 9 to 14 months are common on this equipment class [S4]. For buyers, a similar spec discipline is described in Steel Sourcing Spec Guide: Mill Qualification, Incoterms, and 2026 Risk Controls for upstream metallic inputs, and the same pre-qualification logic applies to kiln refractory and ducting suppliers [S4]. Material handling around screening, pelletising, and bagging is a candidate to evaluate vibratory equipment against the criteria in Vibratory Feeder Specifications Explained: Drive, Tray, Frequency, and Throughput, since throughput matching between the screener and downstream packaging is the most common source of plant bottlenecks in the 10,000 to 20,000 MT band [S4].
Signals Worth Tracking
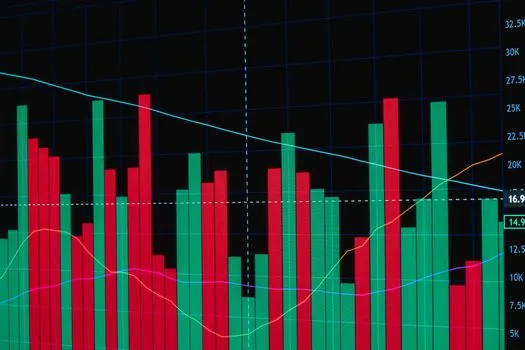
Three trackable signals will move 2026 to 2027 plant economics: PFAS maximum contaminant level finalisation in the US EPA and EU drinking water directives, since both are explicitly GAC-mandated and the multi-year infrastructure cycle is just starting [S5]; the next round of coconut shell price moves, after Jacobi Carbons raised prices on all coconut shell activated carbon grades in July 2025, which is the most recent verified reference price action in the research [S5]; and the IMARC 2026 forecast of the global activated carbon market moving from USD 489.54 million in 2025 to USD 802.12 million by 2034 at a 5.64% CAGR, which sets the demand envelope for any new DPR [S3].