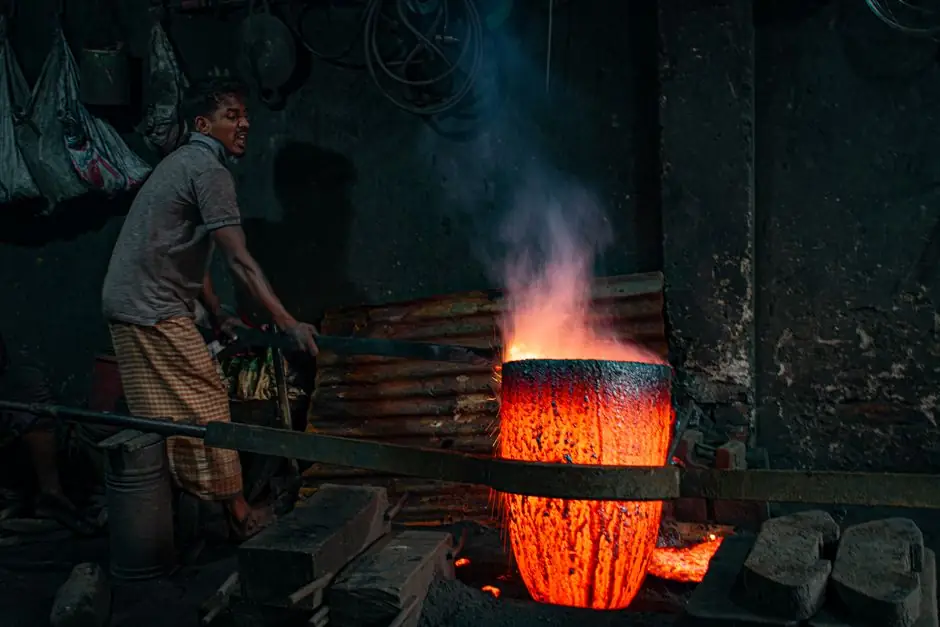
LME aluminium closed at $3,257.05 per tonne on 2026-09-23, with a daily change of +3.250 (+0.10%), a monthly gain of 1.36% and a yearly gain of 22.82% against the prior cycle [S1]. The Q3 2026 consensus forecast on the same feed sits at $3,303.51/t, so the spot tape is already trading roughly $46/t below the implied quarterly mean, a useful procurement signal for anyone with a quarterly index-linked billet or primary aluminum contract.
Behind that headline sit three forces: a structural global deficit that pulled LME warehouse stocks below 300,000 tonnes for the first time since 2022 [S2]; a Middle East shock that took EGA Al Taweelah and Aluminium Bahrain offline, removing more than 6% of global primary supply at the peak [S3]; and a regional premium reset that put European duty-paid metal at roughly $612/t and Japanese material at $302/t over LME, both about 70% above pre-conflict baselines [S8]. The whole stack now matters because most downstream specs (extrusion billet, can sheet, foil) inherit the LME number, then add a regional premium, a product upcharge, freight, and energy.
Where the price actually sits across 2026
The price tape has been volatile but stair-stepping higher. Year-on-year, LME is up 22.97% per Trading Economics, with the 2026-09-23 print at $3,257.05/t against a yearly reference change of +607.80 [S1]. J.P. Morgan Commodities Research now models 3Q 2026 at $3,800/t and 4Q 2026 at $3,700/t, both materially above the May 2026 baseline on supply-disruption risk [S3]. The recovery story is consistent across houses: LME bottomed around $3,085/t in July 2026, and the Trading Economics 3-month model now prints roughly $3,144/t as a Q3-end consensus with a 12-month target near $3,308/t [S2]. Fitch Ratings frames the move as cumulative: "aluminium prices rising around 20% since the beginning of the Iran conflict in late February 2026" [S5].
Conversion into pounds and into regional stacks is what a buyer actually pays. At $3,200/t LME in early 2026, the per-pound conversion is $3,200 / 2,204.62 = $1.45/lb [S4]. Add the U.S. Midwest Premium of about $1.00–$1.05/lb and a U.S. Midwest landed price of roughly $2.45–$2.50/lb is realistic; European landed at LME plus a $0.55–$0.60/lb regional premium gives $1.91–$2.05/lb; Chinese SHFE-equivalent converts at roughly ¥24,170–24,280/t to $3,460–$3,510/t ($1.57–$1.59/lb) [S4]. On 2026-09-20, the global print was $3,291.68/t and the Chinese spot tape at ¥22,048/t tracked the same structural gap [S7].
Cost stack: power, alumina, and the APAC advantage
Fitch's June 2026 sector note draws the line at power and alumina. APAC smelters are favoured because "their cost bases are less exposed to imported gas and spot raw-material volatility" and because integrated bauxite-to-metal chains in China insulate margins when alumina spikes [S5]. China Hongqiao's green-electricity exposure sits around 40% and Chinalco's aluminium capacity is supported by 55% green-energy power, both of which compress carbon-adjusted power cost versus European peers burning gas-indexed electrons [S5]. The same report flags the structural cap: "restrictions on new smelting capacity in China are keeping alum[ina]…", a Chinese supply ceiling that mechanically keeps primary tight even if demand softens.
Power is the single biggest swing factor in the smelter cost curve. A 1 cent/kWh move in power on a benchmark 13.5–14.0 kWh per tonne of aluminium cell consumption is therefore a $135–$140/t swing in the variable cost line, before any regional premium is added. That is why the APAC grid mix matters more than headline LME pricing on the upstream side, and why a European or U.S. smelter with grid power near 8–10 cents/kWh is structurally uncompetitive at $3,200–$3,300/t LME without a healthy regional premium. For downstream processors, the right read is to track regional premium, alumina spot and grid carbon intensity as one bundle, not as separate lines.
Regional premium and landed-cost math
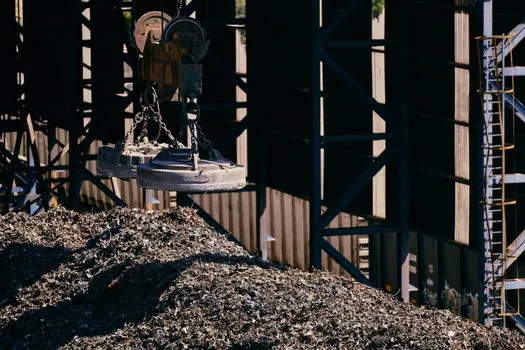
The post-conflict premium reset is now the dominant landed-cost lever. CME Group reports Europe at roughly $612/t and Japan at $302/t, both about 70% above pre-war levels, creating "regional price risks" for buyers who used to assume parity [S8]. The same source frames the value chain: when freight, insurance, war-risk surcharges, and billet upcharges stack on top, a European extruder paying $612/t premium plus a typical $200–$300/t billet product upcharge is sitting at roughly $1,000–$1,200/t above the bare LME print, before freight.
For a U.S. Midwest buyer, the equivalent stack is LME plus a Midwest Premium that rose to about $1.00–$1.05/lb by January 2026, which at $3,200/t LME implies a landed price near $2.45–$2.50/lb [S4]. The same source gives a per-grade matrix that should anchor any RFQ: primary virgin LME base $1.40–$1.55/lb, U.S. landed $2.40–$2.60/lb; clean 6061 extrusion scrap $0.85–$1.05/lb; painted 6063 $0.70–$0.90/lb; clean sheet $0.60–$0.80/lb; clean cast $0.45–$0.65/lb; UBC cans $0.50–$0.75/lb [S4]. This is also where downstream markets diverge: the 2026 extrusion pull is concentrated in construction and transport, with aluminum extrusion 2026 demand by end market tilting to curtain-wall and EV battery tray programmes, while aluminum can sheet supply tightens as recycled content targets diverge and pulls more P1020A away from can-sheet lines. For processors using aluminum veneer panel finishes, the 70% European premium jump is a direct cost input that the previous decade's contracts never priced in.
What this means for procurement and capacity decisions
J.P. Morgan's base case reads: 3Q 2026 at $3,800/t, 4Q 2026 at $3,700/t, on continued supply tightness [S3]. Trading Economics' own model is more conservative, with the 3-month projection near $3,144/t and the 12-month at $3,308/t [S2]. Fitch's 20% move since the February 2026 Iran conflict and the 70% jump in European and Japanese premiums describe the same tape from the cost-of-supply side [S5][S8]. For a procurement team, the comparison is clean: bull case (J.P. Morgan) implies a 16–17% premium to spot, base case (Trading Economics) implies a 1.5% move, and the regional premium stack adds $300–$612/t of own-currency risk on top of any LME move.
The downside scenario is real but weighted low. Trading Economics cites a 20–25% bear case probability tied to "Chinese production rebound plus global recession" [S2]. The constructive case rests on three things that can actually be tracked: (1) LME warehouse stocks staying below the 300,000-tonne mark, (2) alumina prices failing to spike in line with the metal, and (3) the Middle East shipping corridor through Hormuz staying partially disrupted [S2][S3][S5]. On the supply side, China Hongqiao's outlook was revised to Positive on 2026-05-28, Vedanta was upgraded to BB- on 2026-04-02, and Chinalco is flagged for positive earnings impact despite its top-down IDR [S5]. The read-through is that APAC low-cost smelters are earning through the cycle while European and U.S. mid-cost capacity sits uneconomic at any LME below roughly $2,600/t before premium.
For an engineering spec writer, the practical guidance is: (1) hedge or fix the LME leg with a 3-month strip near $3,303.51/t [S1] if your bill of materials is heavy on primary; (2) bake a $600/t European or $300/t Japanese premium into any 4Q 2026 RFQ that ships out of region; (3) treat the 70% premium reset as structural until LME warehouse stocks sustain above 500,000 tonnes for two consecutive months; (4) prefer APAC-sourced billet and aluminum ladder feedstock where the buyer's spec accepts it, since the power-cost gap will keep APAC supply tighter for longer. Trackable signals to watch over the next two prints: LME warehouse tonnage relative to the 300k threshold, the J.P. Morgan 4Q 2026 $3,700/t line, and any CMA CGM / Hapag-Lloyd war-risk surcharge revisions on the Hormuz lane.