
The antimony (Sb) market hit a recorded high of $59,750 per tonne on 4 July 2025, roughly $27.50 per pound, before falling 36% to $20.30 per pound by November 2025 as elevated prices forced flame-retardant converters and lead-acid battery alloyers to cut draw [S1][S3].
USGS puts the 2025 average at $25 per pound, more than double 2024's $10.24 average, while 2026 European prices retreated to a Pricing Index of 35.38 in March 2026, an 18.1% drop from December 2025, and S&P Global tracks metal through 2026 at roughly $27/kg [S1][S5][S7].
What actually happened between August 2024 and November 2025
Chinese export controls on antimony were announced in August 2024, then escalated to an outright ban on shipments to the United States in December 2024; the US antimony metal price moved from $9.80 per pound in August 2024 to $18.10 per pound in December 2024, a near-doubling in four months [S1]. The rally extended through H1 2025, adding another 52% to reach the $27.50 per pound peak in June 2025, before reversing hard into a 36% correction that bottomed near $20.30 per pound in November 2025 [S1][S3]. A separate retail quote of $51.80 per kg on 23 September 2026 confirms the metal is still trading well above its pre-2024 baseline, down 5.85% year to date but up 171.77% versus the start of 2024 [S4].
The peak price of $27.50 per pound equated to 6.65 times the 2020 average, a level that flipped the market from scarcity rationing into demand destruction within roughly two quarters [S3][S6]. Coverage in March 2026 put the price 36% below the June 2025 peak and described the correction as demand-led rather than purely supply-led [S6].
Where the demand destruction came from
Flame retardants account for roughly 49% of US antimony consumption (metal products category) and roughly half of global end use, making antimony trioxide (ATO) the marginal price-setter for the whole market [S1][S2]. When ATO surcharges flowed through to plastics, textiles, electronics housings, and construction compounds, downstream compounders ran two counter-moves: extended order intervals and aggressive substitution, with brominated polymer reformulations and ATH loading the main technical levers [S2][S3].
Lead-acid batteries are the second pillar at 40% of US use, and S&P Global explicitly flags declining lead-acid battery demand, mainly from electrification of vehicle starting-light-ignition duty, as a structural drag through 2030 [S1][S5]. Antimonial lead recovered from spent lead-acid batteries supplied 12% of US apparent consumption in 2025, a closed loop that does not need new mine output [S1]. Photovoltaic (PV) glass clarified with antimony was the third demand pillar cited in the original 2024-2025 squeeze, with the rally partly fuelled by solar panel build-out before PV-side buying also stepped back at the peak [S6].
Supply response: who is adding metal and who is not
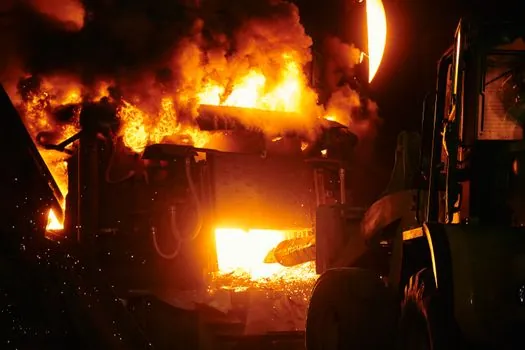
China, Russia, and Tajikistan together produced more than 85% of mined antimony in 2025, roughly 40,000 t, 32,000 t, and 22,000 t respectively, with smaller volumes from Bolivia, Myanmar, and Turkey [S3]. The processing chain is even more concentrated: Chinese, Belgian, and French converters dominate ATO, and most non-Chinese smelters still ship concentrate to Chinese toll converters for trioxide, which is why mining diversification alone does not break the bottleneck [S2][S3].
Southeast Asian smelting capacity, specifically in Thailand and Vietnam, scaled significantly after mid-2025 and was the marginal source of new metal units in early 2026, cited by Fastmarkets as the main reason the China-international price gap narrowed through 2026 [S2]. In the United States, one Montana operation began mining antimony in 2025 and produced primary metal and oxide from imported feedstock, while an Idaho project broke ground in October with a conditional $80 million award from the US Department of War and 14 million tons of proven and probable antimony reserves [S1]. The Pentagon also signed a $245 million antimony offtake with United States Antimony Corporation, a contract scale large enough to underwrite domestic refining economics even at sub-peak prices [S3].
How the price curve compares across reported assessments
Reference benchmarks diverge by definition rather than by physical reality, so a process engineer comparing them must read the units carefully: US Geological Survey publishes the annual average in dollars per pound, Fastmarkets and S&P Global publish per-tonne metal assessments, IMARC publishes a regional pricing index, and retail investment desks publish per-kg quotes with a built-in premium [S1][S2][S5][S7][S4].
The comparison below lines the main 2025-2026 datapoints against four criteria: price level, units, source, and what each one implies for a procurement decision.
USGS 2025 average price: $25 per pound, source USGS Mineral Commodity Summaries 2026, implies the long-run contract baseline that flows into depletion-allowance and import-reliance math for US buyers [S1].
June 2025 peak: $27.50 per pound, source USGS, the recorded monthly high that triggered demand destruction and downstream substitution through H2 2025 [S1][S3].
November 2025 trough: $20.30 per pound, source USGS, the post-correction low and roughly 36% below the peak [S1][S3].
Fastmarkets 4 July 2025 high: $59,750 per tonne metal, source Fastmarkets, the international metal assessment rather than US-domestic, useful for non-US converters and ingot buyers [S2].
S&P Global 2026 trajectory: roughly $27/kg through 2026, source S&P Global Commodity Insights antimony market report August 2026, reflecting the cost-curve-implied steady-state band that keeps the marginal new project economic [S5].
IMARC Europe March 2026: Pricing Index 35.38, an 18.1% drop from December 2025, source IMARC, a regional read for European compounders and trioxide buyers [S7].
Strategic Metals Invest retail, 23 September 2026: $51.80 per kg, source strategicmetalsinvest.com, a small-lot retail price with a built-in premium of several times the wholesale assessment, useful only as a sanity check, not as a procurement quote [S4].
What it costs a buyer now, and what moves the number
Process-engineer reality: the marginal cost driver for a plastics compounder or a battery grid producer is not the published metal price, it is the ATO surcharge in their flame-retardant masterbatch or the alloying premium in their grid paste. Both move with antimony metal with roughly 70-90% pass-through on a 3-6 month lag, so the June 2025 peak showed up in compound price lists in late 2025 and the November 2025 trough is showing up in 2026 contract renewals [S2][S3].
Total cost of ownership has three layers beyond the metal: toll-converting fees at the ATO plant, which spiked when Chinese converters prioritised Chinese-domestic customers, freight and insurance premia for non-Chinese routes, which added several percent during the peak, and inventory carrying cost, which rose sharply as buyers shifted from just-in-time to buffer-stock ordering between Q3 2024 and Q2 2025 [S2][S3]. The 2026 reversal is now working in reverse: compounders are drawing down buffer inventory, lead-acid battery alloyers are negotiating multi-quarter fixed-price antimony units, and the flame retardant synergist supply chain pages for Sb2O3 are being re-read with a much wider substitution tolerance than they carried in 2024 [S2].
Where this goes through 2030, and the signals worth tracking
Both Fastmarkets and S&P Global frame 2026 as an adequately supplied year, with Southeast Asian capacity additions, softening lead-acid demand, and stable flame-retardant offtake combining to keep the market balanced at roughly $27/kg through the year [S2][S5]. S&P Global's published 2026-2030 demand growth is about 3% per year, almost all of it from non-battery end uses such as PV glass, defence alloys, and specialty semiconductors (GaSb, InSb), which is slow enough that any new primary mine of meaningful scale would re-tighten the market within 12-18 months of first pour [S5].
Two nodes are worth watching through 2027: first, the Idaho antimony project, where 14 million tons of reserves and an $80 million DoW award sets a hard schedule that, if met, materially changes the North American supply picture, and second, the European ATO toll-converting base in Belgium and France, where any licensing or environmental action would re-concentrate the processed-supply chain in ways that dwarf the mining diversification story [S1][S2][S3]. A third, smaller signal is the lead-acid recycling rate, which already supplied 12% of US apparent consumption in 2025 and is the swing variable between primary-mine and secondary-loop pricing on any given quarter [S1].
For component-level specifications, see construction machinery and equipment, and lighting equipment and electric lamps.
See also our earlier report, Benchtop optical comparator screen size and stage travel comparison checklist.