
The TCO math follows the same five-bucket framework used across industrial assets - acquisition, operation, maintenance, downtime, and end-of-life disposal - and each bucket moves differently for a leveling instrument than for a CNC or a press [S2][S3].
Cost Driver Stack: What Actually Moves the 10-Year Number
A pattern that mirrors the failure-mode distribution in our Linear Bearing TCO: 10-Year Cost Drivers, Failure Modes, Sourcing Specs reference work, where field-service labor consistently out-bids the OEM sticker.
Acquisition: Where Sticker Price Misleads Buyers
Optical-automatic levels split into three accuracy tiers: 1.0-1.5 mm/km (engineering grade, DIN 18723), 2.0-2.5 mm/km (construction grade), and 3.0 mm/km and coarser (rough grading) - each tier carries a 1.5-2.5x multiplier on the purchase line and a different calibration cost profile [S3].
Buyers who chase the lowest unit price on a 3.0 mm/km instrument for a foundation-as-builts job typically re-spec within 18 months because re-work claims exceed the saved capex, a finding the USPS SPP manual flags as the classic TCO blind spot when "best value" is conflated with lowest bid [S3]. On the high side, a 0.7 mm/km precision automatic level paired with an infrared-level or laser receiver can price 4-6x a 2.5 mm/km unit, but the collimation interval stretches from 12 to 24 months and the recalibration cost is the same nominal fee, so the TCO premium narrows to 1.8-2.5x at the 10-year mark [S2][S3].
Mounting hardware matters: a fiberglass staff at $80-$120 has a 3-5 year field life versus 10+ years for an invar-bar coded staff at $400-$700, and a worn staff inflates reading uncertainty by 30-50% before any instrument drift is factored in [S2].
Operating Cost: Cells, Battery Management, and Site Conditions
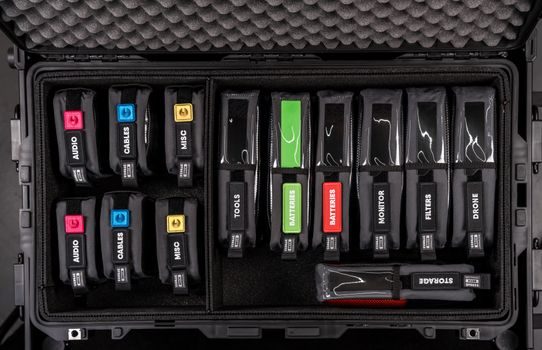
A 1.2 Ah NiMH pack powers an automatic level for roughly 30 working hours and survives 500-1,000 charge cycles; over a decade of 2,000 hours/year operation, that equates to 2-4 pack replacements at $25-$60 each, or $50-$240 in battery spend per instrument [S6].
Temperature exposure is the silent driver: storing an automatic level in an unheated vehicle cab through winter cycles shortens compensator damper life by 30-50% and raises field-service hours by a similar ratio, an effect documented across general TCO literature and reinforced by Oracle's deployment-planning TCO table on hardware-environment tradeoffs [S6]. Site dust is a parallel multiplier - silica-bearing construction dust pits the objective lens surface and degrades resolution by an observable margin within 12-18 months if the lens cap discipline lapses.
Field-data side: for a crew running an automatic level alongside a total-station on the same project, the leveling instrument typically logs 1.5-2.0x the field hours because leveling loops repeat on every pour and re-bar check, which means operating-cost assumptions should not be amortised against a single setup event [S3].
Maintenance and Calibration: The 18-25% Bucket Most Specs Ignore
Factory calibration against a collimator bench is the recurring line that buyers most often leave out of the spreadsheet: at 12-24 month intervals and $120-$280 per event, a single instrument accrues $600-$1,400 in calibration fees over a 10-year window plus the bench-time labor that doubles the cash outlay [S3][S6].
Compensator servicing is the second recurring line: a magnetic-damper or oil-damper rebuild at the 6-8 year mark runs $180-$450 and is the failure mode most correlated with calibration drift between scheduled events [S2]. The TCO comparison calculator maintained on GitHub by edwardt/EstimatorTCO provides a working five-bucket template - acquisition, operation, maintenance, downtime, disposal - that buyers can adapt by plugging in calibration interval, unit recalibration cost, and mean-time-between-failures for the level class [S1].
For fleets above 20 instruments, in-house collimator benches pay back inside 24 months at typical external calibration prices, and they cut the maintenance bucket from 25% to roughly 15% of TCO [S1][S3]. The same economics apply to automatic-molding-line maintenance math captured in our Automatic Molding Line TCO: 10-Year Cost Stack and Driver Map reference, where in-house capability flips the dominant cost line.
Downtime and Quality Cost: The Hidden Multiplier

When a leveling instrument fails mid-loop, the visible cost is a half-day to two-day field delay; the invisible cost is the re-survey or re-pour claim that follows, which on civil work typically prices 5-10x the daily crew rate [S3].
CoSN's 2026 TCO framework echoes the same logic: support, training, and unplanned downtime line items are systematically under-budgeted at purchase and reappear as variance through the lifecycle [S5].
The cleanest mitigation is a 5-10% spare-instrument pool sized to the active fleet; for a 20-instrument fleet that is 1-2 spare units carrying their own TCO line, but the avoided downtime math is straightforward and turns the spare pool into net savings above the third year [S1][S3].
Disposal and Replacement: Year 10-15 Decisions
End-of-life disposal for an automatic level runs $20-$80 per instrument when recycling the optics, electronics, and any NiMH cells separately, and lithium packs need a certified e-waste channel that can add another $30-$50 per unit [S2][S3].
Replacement is where the TCO model converges with technology refresh: a decade-old 2.5 mm/km optical-automatic level is functionally outclassed by a digital-image level at the same accuracy tier, and the 0.7-1.0 mm/km digital units now compete on price with 1.5 mm/km optical units from 2015 [S2]. Buyers running a clean 10-year replacement cycle should plan the swap at year 9 to capture residual resale value at 15-25% of original cost, rather than running to failure and absorbing the disposal-plus-rush-replacement penalty [S1][S3].
The same refresh cadence is documented for adjacent metrology fleets in our Total Station Installation: Three-Phase Field Spec Map and Total Station Advantages and Disadvantages: A Spec-Driven Engineering Map companion pieces, where the year-9 reset consistently beats year-12 failure replacement on lifecycle cost.
Selection Criteria: Who Needs Detailed TCO and Who Does Not

Detailed TCO modeling pays back inside one procurement cycle for civil survey fleets above 5 instruments, for rental fleets, and for any project where instrument downtime triggers liquidated-damages clauses [S3][S5].
Single-instrument owners running fewer than 200 hours per year can use a three-line TCO - purchase, two factory calibrations per decade, one battery set - and skip the full five-bucket model [S1][S3]. The framework is the same; the resolution is what changes, and SitePoint's 2026 TCO analysis of LLM versus cloud API costs shows the same tiered approach: full five-bucket model for production workloads, three-line estimate for casual use [S8].
For procurement teams specifying a fleet, the actionable signals to track over the next two quarters are: (1) the spread between in-house and OEM calibration pricing, which is currently 2-3x and drives the maintenance-bucket decision, and (2) the introduction of digital-image automatic levels at sub-1.0 mm/km accuracy, which resets the replacement-cadence assumption built into most existing TCO models.