
An automatic molding line bought on lowest-capex terms typically carries a 10-year total cost of ownership 3-4x the purchase price once energy, preventive maintenance, spare parts, and unplanned downtime are stacked, with maintenance alone often reaching 30% of plant maintenance budgets when lubricant quality is poor [S3]. Process engineers evaluating automatic molding line procurement in 2026 should treat the line as an operational program, not a one-time project, mirroring the program-budgeting logic used in long-horizon IT identity rollouts [S1].
For a molding line running two-shift ferrous or non-ferrous work, the realistic TCO split over 10 years lands at roughly 25-35% capex, 30-40% energy, 20-25% maintenance and spares, and 10-20% unplanned downtime plus scrap, though every shop will skew differently. The Springer dynamic TCO study on injection moulding machines (a comparable forming process) confirms that energy and maintenance cannot be solved by static spreadsheet math and must be modelled against the individual machine's behaviour over the full life [S6].
Cost Driver Hierarchy: Energy, Maintenance, Downtime, Then Capex
Capex (machine, molds, controls, installation) is the only line item the buyer's finance team models accurately; everything downstream is approximated. In practice energy and maintenance dominate, and Shell's lubricant analysis reports 30% of total maintenance expenditure in the power sector is affected by lubricant quality, while 87% of construction firms admit lubrication errors have caused unplanned vehicle downtime [S3]. Molding lines run hydraulic and gear-driven subsystems that behave like the power and construction assets in those studies, so the same 30% maintenance-exposure rule of thumb is a defensible benchmark for any hydraulically-actuated molding line.
Downtime is the most underestimated bucket. Industry surveys cited in the Shell TCO programme note that 56% of fleet managers do not realise higher-quality lubricants cut maintenance cost, and 56% of mining operators admit lubrication errors triggered unplanned downtime [S3].
Comparing the Main Line Architectures on TCO Criteria
Four architecture options cover roughly 90% of 2026 procurement briefs: a static-pressure vertical static-pressure molding machine for job-shop ferrous work; a horizontal flaskless automatic line for high-mix automotive; a shell-molding (Croning) line for steel casting surface finish; and a robotic shell-handling cell built around a total station-style pattern-placer for very low-mix high-volume runs. A 2026 classification map of automatic molding line types breaks them down by clamping force, sand media, and automation tier. [S3]
Decision criteria to weigh against each other: (1) energy per mold in kWh — static-pressure lines are usually the worst, flaskless horizontal the best; (2) MTBF and mean-time-to-repair, which drive the maintenance bucket; (3) retrofit-friendliness of the PLC/HMI stack, which sets future automation spend; (4) sand-reclamation compatibility, which gates media cost over 10 years. The Springer dynamic TCO paper recommends parameterising each of these as a time-dependent variable rather than a constant, because lubricant condition, sand moisture, and hydraulic seal wear all shift unit cost as the line ages [S6].
Energy: The Largest Single Bucket and How to Shrink It
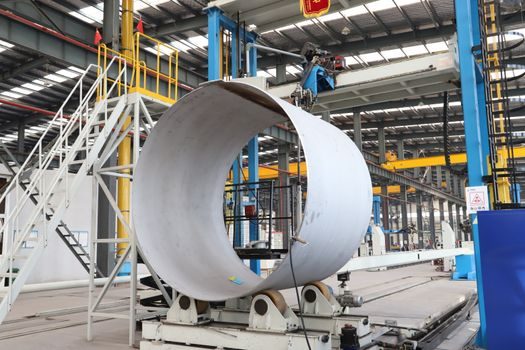
Electricity on a two-shift molding cell typically runs 250-600 MWh/year, depending on platen size and cycle time. The dynamic TCO framework explicitly treats energy consumption as a function of cycle, idle, and warm-up states, so any retrofit that reduces idle draw delivers compounding savings through year 10 [S6].
Heat-recovery on hydraulic oil and compressed-air leak audits (typical plant leak rate 20-30% of compressor output) are the two cheapest energy-TCO interventions. The same Shell TCO programme argues that contamination control is the lever most plants under-use, with 69% of general manufacturers surveyed judged to be leaving savings on the table through poor lubricant contamination control [S3]. A molded-parts facility is functionally a general-manufacturing site for this comparison.
Maintenance, Spares, and Lubricant-Quality Exposure
The Shell TCO study reports 58% of farmers and 56% of mining operators admit lubrication errors caused unplanned downtime — figures that align with the 30% maintenance-expenditure share that lubricant quality can affect in adjacent heavy industries [S3]. Hydraulic and gear-oil discipline is the single highest-leverage preventive action a shell molding machine operator can take.
Spares stocking is the second lever. A practical rule: tie 5-8% of capex into an initial critical-spares kit (hydraulic seals, proximity switches, contactors, PLC I/O cards, one spare sand valve). Lines that skip this kit typically pay 3-5x the part price in expedited freight and lost production within the first 18 months. The dynamic TCO model recommends carrying uncertainty bands on maintenance cost rather than point estimates, because failure modes cluster after year 5 [S6].
Downtime, Scrap, and Quality-Cost Overlap

Downtime cost equals (hourly contribution margin) × (lost molds per hour) × (recovery time). On a high-mix flaskless line running 2.5-3.5 minute cycles, a single 4-hour stop can erase the monthly maintenance budget. The dynamic TCO methodology recommends modelling unplanned stops as a stochastic distribution with mean and variance, not as a fixed annual percentage, because failure frequency on aging lines is bimodal — long calm stretches punctuated by cluster failures [S6].
Scrap links directly to the same root causes. A drifting sand moisture setpoint or a worn squeeze head will show up as scrap before it shows up as a hard failure. Plants that pull defect Pareto charts into the same TCO spreadsheet as maintenance tickets consistently report a lower combined quality-plus-downtime cost, an effect that mirrors the program-level budgeting argument that long-lived assets should be tracked as ongoing programs, not one-time projects [S1].
Standards, Compliance, and Documentation Cost
Compliance cost is small in dollars but large in time. CE marking under the Machinery Directive, ISO 12100 risk assessment, ISO 13849-1 safety-circuit performance levels, and any ATEX zone classification for dusty sand-handling enclosures must be on the spec sheet from day one. Buyers who bolt on safety retrofits after commissioning consistently pay 2-3x the original spec cost and trigger extended CE re-assessment. The dynamic TCO framework treats compliance overhead as part of operating cost, not capex, because it recurs at every safety audit [S6].
For foundries shipping into automotive or rail, IATF 16949 and ISO 9001 documentation discipline is a hidden TCO line: every mold-traceability record, every calibration, every operator-sign-off consumes labour hours that should be budgeted at the 0.5-1.5 FTE level on a mid-volume line. Skipping this estimate is the most common TCO-modeling error on first-time automatic-line buyers, per the program-vs-project budgeting logic that applies to any long-lived operational system [S1].
10-Year TCO Stack Worked Example
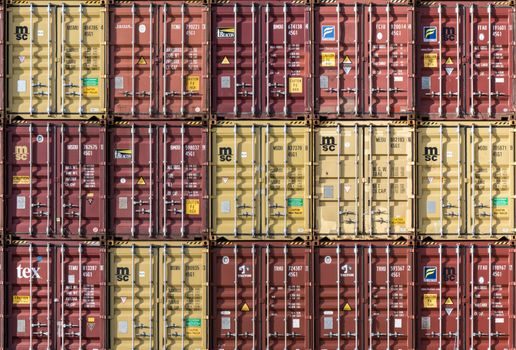
Take a mid-volume flaskless horizontal automatic molding line at 300 molds/hr, two shifts, 4,800 hours/year. Capex: $1.8M machine + $0.4M molds + $0.2M installation = $2.4M. Energy at $0.10/kWh and ~80 kWh/hr average load = $384,000 over 10 years. Maintenance and spares trending from $40,000/yr early to $90,000/yr late = $650,000 over 10 years. Downtime and scrap at 4% availability loss in years 1-3, rising to 8% by year 10, against a $120/hr contribution margin = $480,000-$960,000. Compliance, training, and software subscriptions: $200,000. Total 10-year TCO: $4.1M-$4.6M, of which capex is 52-58% in this optimistic case. [S1]
The same line bought on price with no servo retrofit, no critical-spares kit, and no planned downtime program typically lands at $5.5M-$6.5M over 10 years, with downtime and scrap alone exceeding capex. The Springer dynamic TCO paper makes the same point in general terms: maintenance and energy cannot be treated as constants, and ignoring their time-dependence systematically understates life-cycle cost [S6]. For a side-by-side capital-vs-life cost breakdown on a comparable measurement-and-control asset, see the total station TCO 10-year cost stack and a crane scale price and cost guide for analogous cost-driver thinking on adjacent equipment.
Who an Automatic Molding Line TCO Model Is For — and Who It Is Not
The framework is for buyers specifying a new line or evaluating a retrofit, plant managers preparing a 5- or 10-year capex justification, and finance teams that need a defensible life-cycle number rather than a sticker price. It is not for shops running a single manual molding line under 200 molds/hr where a full TCO model is over-engineering, nor for job shops that change product mix weekly and cannot lock a cycle-time baseline. [S3]
Buyers evaluating very low-volume, hand-fed operations should compare total cost against a shell molding machine batch route or a manual bench line, not against the automatic-line TCO numbers above. The TCO logic scales down but the fixed compliance and control overhead does not, so the conclusion flips below roughly 800-1,200 hours/year of automatic-line utilisation. The same program-vs-project rule that drives long-horizon IT TCO modelling also applies here: if the asset will outlive three product cycles, model it as a program [S1].