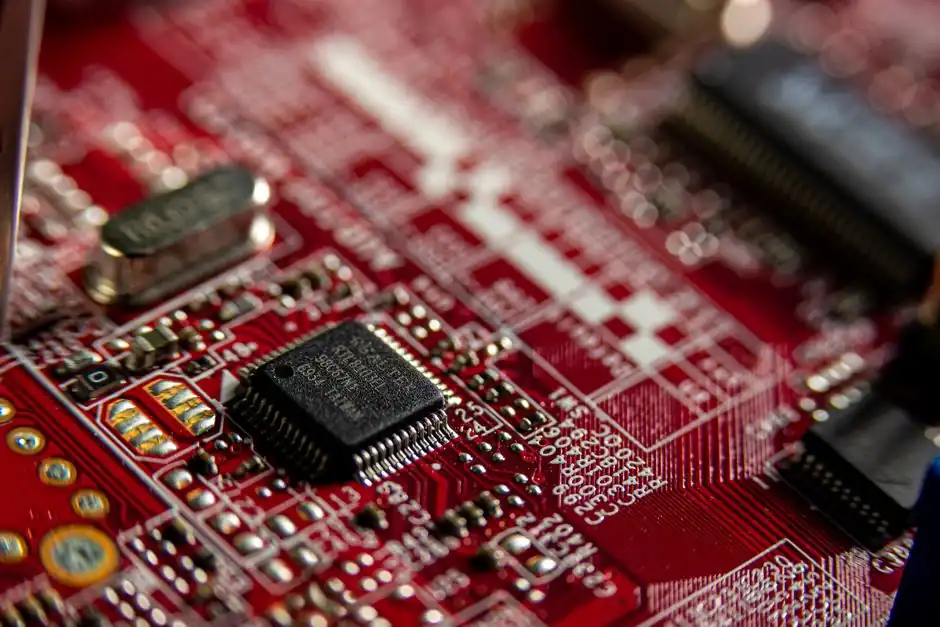
Battery electric vehicles already account for 54.19% of 2025 automotive semiconductor revenue despite a smaller production share, confirming that chip content per unit, not unit volume, now drives value growth in the segment [S2].
The global market is sized at USD 107.34 billion in 2026, up from USD 99.74 billion in 2025, on a 6.72% CAGR toward USD 148.57 billion by 2031 [S2]. Competitive intensity is rising as integrated device manufacturers (67.58% share in 2025) face fabless challengers tracking an 18.43% CAGR through 2031 [S2].
Memory per vehicle: $111 to $275 in five years
Average memory content per vehicle is expected to increase from approximately $111 in 2025 to about $275 by 2030 [S4]. Power semiconductors captured 38.0% of 2024 chip revenue at USD 18.1 billion, reflecting the silicon carbide (SiC) and IGBT content inside EV inverters, onboard chargers, and DC-DC converters [S5]. Microcontrollers held 27.0% (USD 12.8 billion) and sensors 21.0% (USD 10.0 billion), with sensors forecast to expand at a 17.61% CAGR through 2031 as camera, radar, and LiDAR counts per vehicle multiply [S2][S5]. The supply chain picture is detailed further in this supply-chain resilience briefing on Mobility Global.
Application mix: powertrain first, ADAS fastest
Powertrain and electrification captured 32.71% of 2025 semiconductor revenue, while ADAS is projected to post the fastest growth rate of 17.81% CAGR between 2026 and 2031 [S2]. By application in 2024, EV powertrains held 31.0% (USD 14.7 billion), ADAS 24.0% (USD 11.4 billion), infotainment 18.0% (USD 8.6 billion), power management 15.0% (USD 7.1 billion), and autonomous driving 12.0% (USD 5.7 billion) [S5]. Internal-combustion vehicles are forecast to trail with a 17.49% CAGR through 2031, a slow growth rate that is shrinking their share of the silicon budget even as fleet sizes stay large [S2]. This application shift drives the spec changes covered across our encyclopedia entry on pressure transmitters in vehicles, since the same zonal controllers that host ADAS also host tire-pressure and brake-pressure sensor conditioning.

By propulsion in 2025, battery electric vehicles took 54.19% of semiconductor market share, an unusual concentration given that BEVs are a minority of global light-vehicle output [S2]. Strategic Market Research splits 2024 demand differently by vehicle type, with passenger cars at 52.0% (USD 24.7 billion), EVs at 24.0% (USD 11.4 billion), commercial vehicles at 17.0% (USD 8.1 billion), and autonomous vehicles at 7.0% (USD 3.3 billion) [S5]. The two cuts are not contradictory: the 54.19% figure in [S2] is propulsion-typed revenue across all vehicle categories, while the 24.0% in [S5] is the EV share of the passenger-car-only slice. Light-vehicle output in India hit 5.8 million units in 2025 (a 9% annual rise) and Southeast Asian assembly topped 3.2 million units, adding entry-level semiconductor content such as stability control and basic sensor clusters [S2].
Regional concentration: Asia Pacific 45.87%, Middle East fastest
Asia Pacific commanded 45.87% of 2025 automotive semiconductor revenue, supported by a Chinese industrial policy that subsidizes both fab capacity and EV production [S2]. Strategic Market Research pegs the region at 46.0% (USD 21.9 billion) in 2024, North America at 24.0% (USD 11.4 billion), Europe at 22.0% (USD 10.5 billion), and Rest of World at 8.0% (USD 3.8 billion) [S5]. The Middle East is forecast to log an 18.12% CAGR for 2026-2031, the fastest of any region, on the back of sovereign-wealth programs building out fab and assembly capacity rather than just consuming chips [S2].
Driver impact on CAGR: electrification is the largest single lever
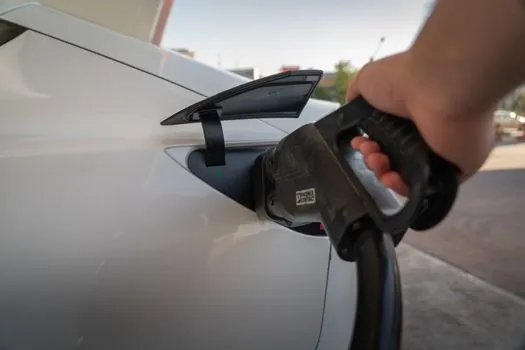
Mordor's driver-impact table isolates six forces moving the forecast. Electrification boosting semiconductor content per vehicle adds +4.1% to CAGR, the largest single contribution, with global reach led by China, Europe, and North America on a 2-4 year timeline [S2]. Rising demand for advanced safety and comfort systems adds +3.2% on a short (≤2 year) timeline, with early adoption in North America and Europe [S2]. Zonal E/E architectures and software-defined vehicles contribute +2.9% on a long (≥4 year) timeline concentrated in premium segments; increasing vehicle production in emerging economies adds +2.8% in Asia Pacific and Middle East/Africa; SiC and GaN power devices add +2.4% with strong China and Europe uptake; and government incentives for auto-grade foundry capacity add +1.7% across North America, Europe, and Asia Pacific [S2].
Supply risks and bottlenecks heading into late 2026
Memory and high-performance SoC supply remain the two most cited bottlenecks, with the 2021 chip shortage now treated as a structural rather than cyclical risk [S1]. The transition to zonal architectures is shortening automotive product cycles, putting pressure on IDMs that are used to multi-year qualification windows for AEC-Q100 grades [S1]. Hyperscaler and mobile-chip specialists entering the centralized-compute socket are also tightening competitive pressure, with fabless vendors tracking an 18.43% CAGR through 2031 versus the 67.58% IDM share in 2025 [S2]. Sensing integration is rising in parallel, and the encyclopedia overview of sensor-conditioned limit switches shows how the same zonal-controller trend is pulling instrument-grade conditioning silicon into vehicle ECUs.
What the numbers do not yet settle

Two of the most-cited 2026 market-size estimates differ materially: Mordor puts 2026 at USD 107.34 billion and 2031 at USD 148.57 billion (6.72% CAGR) [S2], while Fortune Business Insights has 2026 at $85.38 billion and 2034 at $166.17 billion [S3]. SNS Insider's 2025 base of USD 56.28 billion climbing to USD 148.65 billion by 2035 [S6] and Strategic Market Research's 2024 base of USD 47.5 billion reaching USD 90.3 billion by 2030 (9.6% CAGR) [S5] are both lower-base, higher-CAGR cuts. The spread is driven mainly by how each house treats ADAS L2+ attach rates, SiC inverter penetration, and whether software-defined revenue is counted at the chip level or the platform level. Track the next revision of TechInsights' per-vehicle memory figure and the Q4 2026 IDM versus fabless share split for a cleaner read on whether the 6.72% or 9.6% CAGR trajectory is the right one to plan capital around.
Component reference pages worth checking: concrete vehicle.