
Global battery pack demand is on track to reach 4.2 TWh in 2030 and 6.8 TWh by 2035, with more than 85 percent of new capacity tied to EV applications, per McKinsey analysis [S1].
BMS revenue is forecast to rise from USD 14.24 billion in 2025 to USD 17.21 billion in 2026, a 15.55 to 18.95 percent CAGR depending on the source, with the long-run ceiling near USD 80.74 billion by 2035 [S3][S4]. The Li-ion pack market itself is sized at USD 170 billion in 2026, rising to USD 320 billion by 2036 at a 6.5 percent CAGR [S6].
Where the supply chain is splitting: cells, packs, and end-of-life
Three layers are decoupling, and each one is now a separate sourcing decision: upstream cell manufacturing (concentrating in a small number of gigafactories), midstream pack assembly and BMS integration (regionalising around EV OEM clusters), and downstream reverse logistics for retired packs (emerging as a standalone margin pool) [S1][S2].
The 2026 Michigan battery supply chain audit from the University of Michigan confirms the same pattern at state level: gigawatt-hour cell capacity is being built in distinct clusters, while pack and module lines, plus BMS software talent, are lagging and creating binding workforce gaps for tier-1 and tier-2 suppliers [S5]. Practical procurement implications, especially around spec discipline, are covered in Lithium Battery Procurement: A Spec-First Buyer's Workflow for 2026.
BMS market size, segments, and what is actually being bought
Precedence Research sizes the BMS market at USD 14.24 billion in 2025, USD 17.21 billion in 2026, scaling to USD 80.74 billion in 2035 at 18.95 percent CAGR [S3]. Fortune Business Insights is more conservative: USD 16.30 billion in 2026 to USD 51.78 billion by 2034 at 15.55 percent CAGR [S4]. The spread is mostly definitional: Fortune scopes tighter to on-road EV BMS, while Precedence includes stationary storage and industrial UPS-class installations.
By application, automotive held over 55 percent of 2025 BMS revenue; by battery chemistry, flow batteries captured over 32 percent of 2025 BMS dollars, reflecting the strong BMS attach in long-duration storage stacks [S3]. North America accounted for 33 percent of 2025 BMS revenue, the largest single regional block [S3].
Cell-to-pack vs. module-to-pack: how the BMS footprint is shifting
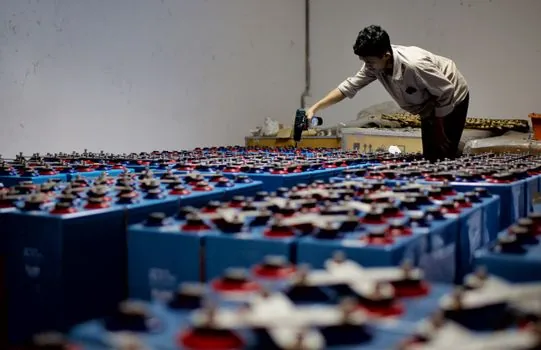
Two pack architectures dominate 2026 builds, and they push BMS hardware in opposite directions. Cell-to-pack (CTP) layouts remove modules and put the BMS master and cell-monitoring chips in direct contact with prismatic or large-format cells, cutting harness mass 10 to 20 percent. Module-to-pack (MTP) layouts keep 12s/14s/16s modules and use a distributed daisy-chain BMS topology, which scales more cleanly into stationary storage racks and second-life packs. [S2]
Choosing between them is a spec decision before it is a sourcing decision. CTP lowers BoM cost and improves energy density at the cell level, but raises BMS PCBA thermal-load budgets and forces tighter SoC tolerance (typically ±2 percent to ±3 percent). MTP is easier to service and reconfigure, but adds harness and connector cost. For a buyer comparing options, the decision gates are pack voltage window (400 V vs. 800 V), serviceability target, and whether retired packs will be cascaded into a Industrial UPS or grid-storage second life. For an explanation of how a BMS sits inside the broader DC Power Supply and Power Supply architecture on a plant floor, see the reference pages linked in this sentence.
End-of-life: reverse logistics is becoming its own margin line
Önden and Önden (June 2026) built an integrated analytics framework for EV battery end-of-life that combines logistic-growth retirement forecasting, ML-based SoH classification, chemistry-specific routing, and a p-median facility location model for the reverse network [S2]. Their Turkish case projects 8.2 million EV batteries retiring by 2050, with a two-wave pattern: 2031 to 2036 dominated by NMC chemistries, post-2038 led by LFP, and roughly 5.3 million packs (about 65 percent) routed to second-life stationary storage rather than direct recycling [S2].
For procurement teams, the operational takeaway is that state-of-health thresholds (commonly 70 to 80 percent of nameplate capacity) are now a contract clause, not an internal note. Buyers should require SoH data export in a documented format (typically CAN or .csv over a service tool), and a clear repurchase or take-back clause for retired packs, before signing large 2026/2027 volume orders. A broader AI-driven traceability view, from mine to pack, is covered in a July 2026 industry feature on AI strengthening battery supply chain traceability [S7].
AI in the BMS: from rule-based protection to predictive SoX

Traditional BMS firmware enforces voltage, current, and temperature windows; the 2026 generation adds ML-based state-of-charge and state-of-health estimators that update on pack-level telemetry, plus early-warning classifiers for thermal-runaway precursor events [S3]. Wireless BMS variants replace the daisy-chain wiring harness with a single master plus per-module radio nodes, trimming pack mass and simplifying assembly, which is why several 800 V EV programs are qualifying them for 2027 model years [S3].
Fleet and remote monitoring via IoT dashboards is now a baseline expectation for grid-scale and commercial-fleet deployments: operators want one pane of glass for state-of-charge, state-of-health, fault history, and cell-balancing events across thousands of packs. Practically, that means 2026 RFPs are starting to require MQTT or REST telemetry APIs, not just CAN bus logs.
Comparative reference: three BMS sourcing profiles for 2026
For a buyer choosing between the three common 2026 sourcing profiles, the decision criteria line up roughly as follows. Profile A, on-road EV master BMS (centralised or distributed daisy-chain, ISO 26262 ASIL-C capable, 400 V or 800 V): typical BoM USD 80 to 180 per vehicle, longest qualification cycle (18 to 30 months), and the most demanding functional-safety documentation. Profile B, stationary storage BMS for containerised LFP racks (1 MWh to 6 MWh per unit, Modbus TCP or CAN, IEEE 1547-compliant): typical BoM USD 25 to 50 per kWh, moderate qualification, and the strongest pull from the AI/ML SoH feature set. Profile C, modular industrial BMS for Switching Power Supply-backed Energy Management cabinets and small commercial storage: typical BoM USD 15 to 40 per kWh, shortest qualification (3 to 6 months), and the most fragmented vendor field. The right choice is set by pack voltage, certification target, and whether second-life routing is in scope. [S2]
Trackable signals through 2027
Two near-term signals are worth monitoring. First, 2026 to 2027 will surface the first wave of NMC-heavy EV retirements in major European and Chinese fleets, which is the moment second-life stationary storage pricing gets a real benchmark; the Önden/Önden framework puts the start of that wave at 2031, but Chinese volume data may compress that timeline [S2]. Second, wireless BMS penetration is the variable to watch on the hardware side: every 800 V program that qualifies a wireless master in 2026/27 effectively de-risks the topology for stationary and industrial users in 2028, which will reshape harness, connector, and PCBA supply chains well before the headline BMS market reaches its 2035 ceiling [S3][S4].