
BMS production capacity planning in 2026 is fundamentally a line-sizing exercise driven by three numbers: kWh target per platform, cell-format share, and the GWh-per-line output the equipment stack can sustain at acceptable first-pass yield [S3].
Greenfield gigafactories now plan in 10-40 GWh single-line steps, replacing the 1-2 GWh increments common a decade earlier, and prismatic cells lead the format mix at an 8.4% CAGR through 2035 [S3]. For context on adjacent process planning, see this electrolyte cost benchmark for dry-room drivers and the related OEM vs ODM electrolyte spec map.
Capacity Sizing Benchmarks and Cell Format Trade-Off
A modern greenfield EV cell line is planned in discrete GWh steps: SK Innovation's 2017 board approval to add two production lines delivering 2 GWh on top of an existing 1.9 GWh base illustrates the conventional doubling pattern still in use [S3]. The 2026 equivalent runs at single-line outputs of 10-40 GWh, a step-change that compresses the per-line labour component but pushes capex into dry rooms, formation cycling, and end-of-line test [S3].
Cell format directly sets the capex-per-GWh slope, with prismatic at 8.4% CAGR through 2035, cylindrical and pouch filling the remainder of the demand curve [S3]. For a reference equipment stack, the ACEY-APAL-ESS line supports prismatic aluminum-shell cells from approximately 100Ah to 314Ah in 1P8S, 1P12S, and 1P13S module configurations, with a liquid-cooled 1P13S module weighing 78 kg at 977 x 182 x 218 mm [S1]. Energy storage lines using this architecture scale from 51 kg (1P8S) to 78 kg (1P13S) per module, giving planners a clear mass-per-kWh envelope when sizing pack fixtures and lifting systems [S1].
Process Equipment Stack and Throughput Drivers
The capacity-limiting sequence runs electrode coating, calendaring, cell stacking or winding, electrolyte filling, formation cycling, and pack assembly, with robot automation present at almost every step because the cell is the most expensive subassembly in any electric car [S3]. A process engineer writing a capacity plan treats each station as a discrete constraint and sizes the bottleneck to set the line's nominal GWh/year output [S3].
Formation cycling is the typical throughput choke point, and purpose-built EV battery test systems contribute to production capacity by parallelising channel count and shortening the high-temperature ageing window without inflating floor area [S3]. The same instrument feeds state-of-charge and capacity data that downstream battery management system firmware relies on for cell balancing and thermal interlocks [S3]. On the pack side, ACEY-APAL-ESS lines integrate barcode scanning and MES data traceability, with automatic recording of OCV, internal resistance, welding, compression, and EOL test data, so every cell is traceable back through the formation log [S1].
Module-to-Pack Architecture and Compression Force Limits
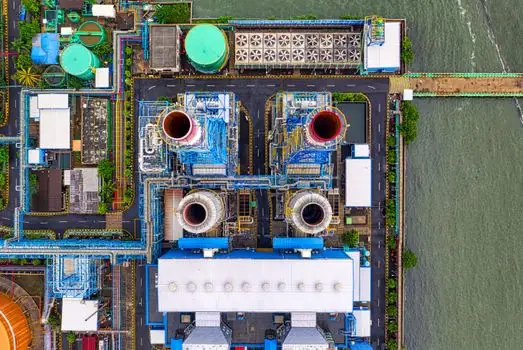
Prismatic module-to-pack design sets the structural frame for the BMS thermal management strategy, and the equipment stack must apply consistent compression force across the cell stack to keep impedance stable. The ACEY-APAL-ESS line delivers an adjustable module compression force from 10 to 1,500 kgf, covering both low-format residential packs and high-format C&I ESS containers [S1].
This 10-1,500 kgf range maps directly to the prismatic cell formats planners actually spec: 280Ah and 314Ah single modules in 1P8S, 1P12S, and 1P13S configurations, all on a common 182 mm width for line retooling flexibility [S1]. The same line supports both liquid-cooled and air-cooled energy storage battery designs, which means a planner can change thermal strategy without replacing the entire equipment stack, a key variable when forecasting 5-year capex on a 10-40 GWh string [S1].
Selection Criteria: Who Needs Full BMS Capacity Planning, and Who Does Not
Full gigafactory-scale capacity planning pays off for any line targeting more than 5 GWh/year output, where the capex envelope justifies a dedicated formation hall and dry-room spec [S3]. Custom pack builders in the 0.1-2 GWh/year band, including most inspection-robot and specialty-vehicle integrators, do not need a full GWh-per-line model; they need a kWh-per-station model that tracks module-format changeover time and EOL test throughput [S4].
For example, an inspection-robot pack spec starts from average power consumption and required operating time: a 300W draw over 6 hours requires a theoretical 1,800Wh, and practical design adds margin for converter loss, operating window, and state-of-charge headroom [S4]. Common system voltages run 24V, 36V, 48V, 51.2V, 60V, and 72V, with 51.2V x 30Ah = 1,536Wh a typical mid-range spec, and the BMS must feed SOC, SOH, voltage, current, temperature, charge status, and fault data to the host controller [S4]. For related thermal-sensor spec work, the bimetal thermometer stem, range, and material gates reference is a useful adjacent read.
Regional Siting and Localisation Logic
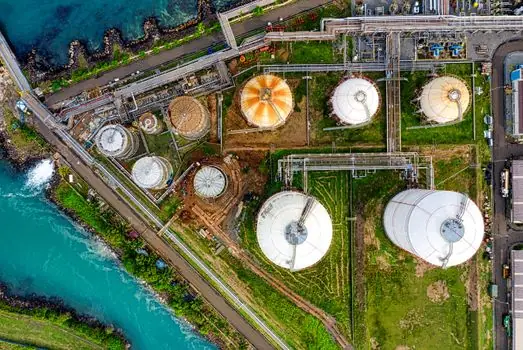
Asia Pacific accounts for the largest share of the EV battery market, with MarketsandMarkets sizing it at USD 43.54 billion in 2025 and projecting USD 138.18 billion by 2035 at a 12.2% regional CAGR, well above the global 5.6% average [S3]. The gap between regional and global growth rates is itself a planning signal: gigafactory siting in Korea, China, and Japan continues to outpace North America and Europe on a per-dollar basis [S3].
Localisation functions as a cost-of-logistics lever rather than a pure subsidy play, because cathode active material, separator film, and electrolyte shipping costs scale with the distance between cell plant and pack plant [S3].
Comparison: ESS Pack Line vs EV Cell Line vs Custom Robot Pack
Three planning archetypes dominate 2026 BMS capacity work, and each stresses a different constraint. The ESS pack line (ACEY-APAL-ESS reference) runs 1P8S to 1P13S prismatic modules at 51-78 kg per module, with 10-1,500 kgf compression, MES traceability, and a 56 x 8.5 x 3.5 m full-line footprint [S1]. The EV cell line runs 10-40 GWh per string, with prismatic at 8.4% CAGR leading format mix and formation cycling as the throughput choke [S3]. The custom robot pack spec operates at 24V-72V system voltage, 1,500-2,000 Wh typical energy, with BMS reporting SOC, SOH, voltage, current, and temperature to the host controller [S4].
On four decision criteria, the spread is clear: capex-per-GWh is highest for EV cell lines (dry room + formation), lowest for ESS pack lines (brownfield module assembly); changeover time is minutes on an ESS pack line with adjustable fixtures, days on an EV cell line when switching prismatic to pouch; BMS firmware integration is deepest on robot packs (real-time host comms), shallowest on ESS containers (slow CAN polling); and lead time is 8-12 weeks for a retooled ESS pack line, 18-36 months for a greenfield gigafactory [S1][S3][S4]. For shop-floor spec context on adjacent material handling automation, the encyclopedia entry covers throughput drivers that map directly onto cell-to-module conveyor sizing.
Limitations and Failure Modes
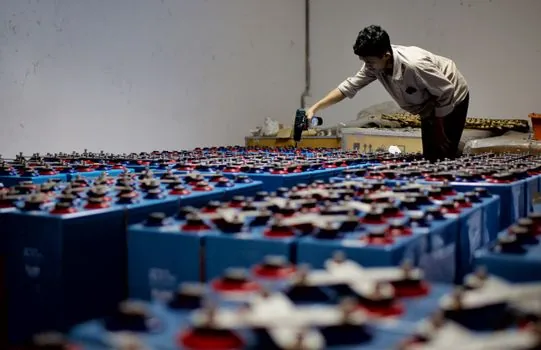
Capacity plans built only on nominal GWh-per-line numbers fail when formation cycling is undersized, because the high-temperature ageing window is the binding constraint and cannot be parallelised without adding floor area [S3]. Equipment stacks that lock in a single cell format (cylindrical only, or pouch only) carry 5-year format-mix risk if the platform roadmap shifts toward prismatic, which is the fastest-growing format at 8.4% CAGR [S3].
Custom robot pack builders face a different failure mode: an undersized BMS communication bus becomes the bottleneck once a fleet scales past a few hundred units, and planners who spec the battery pack without specifying the BMS-to-host protocol end up retrofitting CAN or RS-485 gateways in the field [S4]. Inspecting-robot deployment environments (substations, solar farms, tunnels) add dust, moisture, and temperature-cycle stress, so the mechanical enclosure spec must match IP rating and operating-temperature window before cell selection is finalised [S4].
Track the next two signals to keep the plan current: the 2026-2035 prismatic CAGR (8.4% baseline) and the regional Asia Pacific CAGR (12.2% baseline), both per MarketsandMarkets as cited in [S3]. A 200-basis-point move in either figure shifts single-line output targets by roughly 5-8% on a 10-40 GWh string, which is enough to flip a 2GWh doublestep into a 3 GWh doublestep on the next board review.
Detailed specification references: asrs system.