Q2 2026 cement prices ranged from USD 55/MT in China to USD 256/MT in Germany, a regional spread of roughly 4.6x, with EU ETS carbon cost pass-through, CBAM implementation, and elevated energy expenses cited as the dominant upward drivers on European producers [S1][S2].
US prices firmed to USD 97/MT in Q2 2026 from USD 96/MT in Q1 2026, while Canada reached USD 158/MT and the United Kingdom USD 143/MT, with all three North American and UK figures reflecting higher production costs and infrastructure-led demand rather than tariff-related surcharges on the cement line itself [S3].
What moves the 2026 cement price: carbon, clinker, and oligopoly discipline
Carbon cost is the single largest variable separating regional cement markets in 2026: Europe averaged USD 156.31/MT in Q1 2026, a 1.96% quarter-on-quarter move, with the report identifying EU ETS carbon cost pass-through, CBAM implementation, and energy costs as the three named drivers [S2]. Africa sat at USD 86.72/MT (a 3.11% move) on construction demand and urbanisation, while India held USD 73.32/MT (a 2.97% move) under competitive market dynamics and producer discipline [S2]. The global Q1 2026 average was USD 95.32/MT, up 1.36% quarter-on-quarter, and the report explicitly flagged that European prices are running 3 to 4 times higher than Northeast Asian prices [S2].
On the supply side, the cement industry behaves as an oligopoly with high fixed costs, and producers prefer to cut kiln utilization rather than cut list prices when demand softens, which keeps the cost floor firm even in a soft residential market [S4]. Portland cement, accounting for approximately 95% of global cement output, is produced by heating a limestone-clay mix to 1,450°C in a rotary kiln to form clinker, then grinding with about 5% gypsum, a process that releases CO2 both from fuel combustion and from the calcination of limestone itself [S1]. Global cement output reached approximately 4.1 billion metric tonnes in 2024, with China accounting for roughly 52% of that total [S1]. The cost stack for cement concrete is therefore anchored in limestone feedstock, clinker grinding energy, and the carbon intensity of the kiln fuel mix.
Regional price comparison: how the four tracked markets line up
A side-by-side read of the tracked Q2 2026 cement prices and the cost drivers behind each shows where carbon policy, energy mix, and demand profile actually move the number [S1][S3].
Germany at USD 256/MT leads on elevated energy expenses and EU carbon pass-through; the United Kingdom at USD 143/MT and Canada at USD 158/MT sit in a middle band where energy and steady infrastructure demand dominate; the United States at USD 97/MT reflects stable construction activity plus higher production costs; China at USD 55/MT remains the floor, supported by improving construction demand and infrastructure activity despite ongoing real estate weakness [S1][S3]. The Europe-versus-Asia spread of roughly 3-4x is consistent across both the Q1 2026 global average data and the Q2 2026 regional print [S2].
For procurement teams, the practical read is that EU and UK cement carries a structural carbon premium that does not unwind with a softer construction cycle, while US prices are more sensitive to domestic energy and infrastructure spending, and Chinese prices are anchored by overcapacity and a still-weak property sector [S1][S7].
Cost driver breakdown: what pushes the cement line up or down
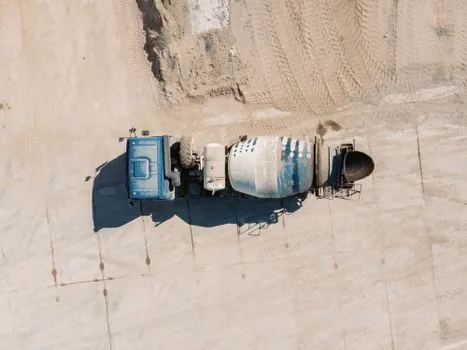
The cement price line decomposes into four stacked drivers, and the Q2 2026 prints make the ranking explicit. First, energy and fuel: kiln coal and power costs continue to support elevated cement prices across all regions, with Germany most exposed to gas-fired power costs [S1][S3]. Second, carbon policy: EU ETS pass-through and CBAM are named as the primary European cost adders, and CBAM in particular forces importers to account for embedded carbon at the border [S2]. Third, clinker and limestone feedstock: limestone makes up approximately 80% of the raw mix, and any movement in mining, grinding, or transport costs feeds directly into the cement ex-works price [S1]. Fourth, demand mix and producer discipline: commercial construction, data centers, warehouses, and infrastructure have been offsetting soft residential demand in 2026, and producer oligopoly behaviour keeps list prices firm even when volumes soften [S4].
Total cost of ownership for the cement line therefore extends beyond the per-tonne price: freight, demurrage, supplementary cementitious material (SCM) substitution such as fly ash or slag, and the carbon price embedded in the EU ETS allowance stack all sit above the headline print. CBAM in particular forces non-EU importers to monetise embedded CO2 that was previously externalised, which structurally lifts the floor for any cement crossing an EU border. Readers cross-referencing decarbonization capex decisions can compare the cement line with the broader clinker and CCUS cost stack, since kiln fuel choice and CCUS retrofit capex feed straight into the same producer cost curve.
Who the high-price 2026 cement market is for, and who should hedge differently
The high-cost 2026 cement environment is most punishing for buyers locked into European supply without long-term contracts, and for any project whose bill of materials carries a heavy Portland cement content. EU-based ready-mix producers and infrastructure contractors sit at the top of the exposure list, since they absorb both the EU ETS pass-through and any CBAM-driven import cost on supplementary clinker [S2]. Indian and Southeast Asian buyers with diversified regional supply are relatively sheltered, because Indian prices moved in a relatively narrow band in Q1 2026 and are not flagged as a carbon-exposed market [S2].
For US-based buyers, the 2026 risk vector is tariff exposure on imported cement rather than domestic carbon pricing, with the US already the priciest of four tracked ready-mix concrete markets in Q2 2026 at USD 86/MT, up roughly 3.9% from Q1, on the back of cross-border cement tariff pressure [S4]. Chinese buyers benefit from the lowest absolute price in the tracked set, but face the opposite risk: continued property-sector weakness and overcapacity can trigger sharp local declines, as seen in Q1 2026 when China recorded the sharpest decline among tracked markets [S7]. Buyers optimising for cost rather than security of supply should weight Chinese and Indian tonnage; buyers optimising for schedule certainty on EU projects should lock in European long-term contracts and budget for sustained carbon pass-through.
Ready-mix concrete, downstream cost, and the 2026 H2 outlook

Ready-mix concrete prices have crept higher alongside cement through H1 2026, with the US at roughly USD 83/MT in Q1 rising to near USD 86/MT in Q2, a 3.9% move, and the global average moving from close to USD 72/MT to roughly USD 75/MT, about 3.8% [S4]. The Q2 2026 tracked concrete prints were United States USD 86/MT, Australia USD 77/MT, Canada USD 71/MT, and Germany USD 65/MT, with Germany remaining the most affordable of the four [S4]. The H2 2026 global average range is forecast at USD 75-83/MT, with the US ceiling at USD 81-92/MT driven by cement import tariff exposure [S4].
The concrete price line inherits the cement cost line directly, since ready-mix is batched from Portland cement, water, sand, and aggregate at a plant and delivered by truck, and the cement component is the dominant material cost [S4]. For downstream specification work, ready-mix buyers referencing cement concrete performance grades should note that the 2026 cost inflation sits on the material line rather than the placement or finishing line, so value engineering on cement content (via SCM substitution) is the highest-leverage cost move available. Industry context for the demand side, including how global cement demand and capacity utilization split into three regional tracks in 2026, reinforces the regional divergence already priced into the cement curve.
Sourcing signals, standards, and the verifiable next nodes to track
The named 2026 standards and regulatory instruments directly bearing on cement price are EU ETS, CBAM, and the US Infrastructure Investment and Jobs Act; the first two are the cited upward drivers on European prices, and the third is the cited demand driver on US prices [S2]. Q1 2026 China recorded the sharpest decline among tracked markets because of continued real estate sector weakness, while the US, UK, Canada, and Germany posted modest gains on infrastructure and steady construction activity [S1][S7].
Trackable next nodes for the rest of 2026 are: the Q3 2026 EU ETS allowance auction clearing price, which directly sets the carbon pass-through component on European cement; CBAM transitional reporting data, which becomes the first hard read on embedded carbon in imported cement and clinker; and the Q3 2026 US and Canada cement prints, which will indicate whether the tariff-exposed ceiling on US prices holds above USD 100/MT or softens with construction demand. The 2026-2027 cement price trajectory is expected to remain upward on the combined effect of EU ETS pass-through, CBAM, and energy costs, with European prices staying high and Indian prices moving in a relatively narrow band [S2].
Spec-level background on the components involved: carbon fiber, and carbon steel.