
Refined copper demand reached approximately 27 million tonnes in 2024, with institutional forecasts pointing to a 330,000 metric tonne deficit for 2026 after supply outages of roughly 800,000 tonnes per year in 2025 and 2026 flipped the market from surplus to shortfall [S3]. The International Energy Agency now projects a 30% supply gap, equating to 10 million metric tons of refined copper per year by 2040 if mining and recycling capacity do not accelerate [S2].
For procurement and specification engineers, the 2026-2030 copper outlook is no longer a commodity story but a structural shortage of conductor-grade material feeding EV drivetrains, grid upgrades, AI data center busbars, and renewable interconnects. Price action has already priced part of this in: LME three-month copper hit a record $14,527.50/mt in January 2026 before retracing to roughly $11,925/mt on March 20, then recovering above $13,000/mt by mid-July [S3]. Forecasters in May 2026 traded the curve near $13,500/mt and projected a 2026 average of $12,075/mt [S3].
Demand Volume by Region and End-Use, 2025-2030
India's copper demand is projected to rise from 1.8–1.9 million tonnes in 2025 to 3.2–3.3 million tonnes by 2030, a 68–83% increase in five years driven by power transmission, EVs, and built infrastructure [S7]. China's copper demand is forecast to climb steadily to 20.02 million tonnes per ICBCS's March 2026 outlook, with prices stabilising at elevated levels early in the year after sharp 2025 gains [S8]. The global copper market was valued at USD 265.08 billion in 2026 and is forecast to reach USD 511.78 billion by 2036, a 6.8% CAGR [S4].
End-use decomposition is concentrating fast: the IEA attributes demand growth primarily to AI data centers, electric vehicles, renewable energy generation, and the HVDC grids that connect them [S2]. Wood Mackenzie's chief energy analyst, cited in the same outlook, expects energy-transition copper demand to grow five-fold through 2040, with producers holding existing infrastructure and expansion capacity best positioned [S2]. A useful cross-read on the aluminum side, which competes with copper in busbar and overhead-line applications, is the parallel 2026 capacity crunch documented in aluminum demand 2026-2030 analysis.
Price Bands, Analyst Consensus, and Forward Curve
The 2026 price band from named institutions clusters between $9,800 and $12,500 per metric tonne, with J.P. Morgan targeting $12,500/mt for Q2 2026 and an annual average of $12,075/mt [S3]. S&P Global Market Intelligence published a 2026 average of $12,100/mt in April 2026, while the World Bank projects closer to $9,800/mt, a 21% spread that reflects genuine disagreement on demand elasticity and Chinese property-sector pull [S3].
Forward indicators point the same direction. Trading Economics projects COMEX at 7.04 USD per pound, approximately $15,500/mt, within 12 months from mid-July 2026 [S3]. Goldman Sachs's metals desk sees a record-high supply deficit emerging by 2026, with the structural shortage underestimated and providing a compelling long-term thesis for established producers [S2]. For a 5N versus 6N producer map relevant to busbar and magnet-wire spec gates, see the high-purity copper manufacturer map.
Supply-Side Constraints: Mines, Ore Grade, and Capital Cycle
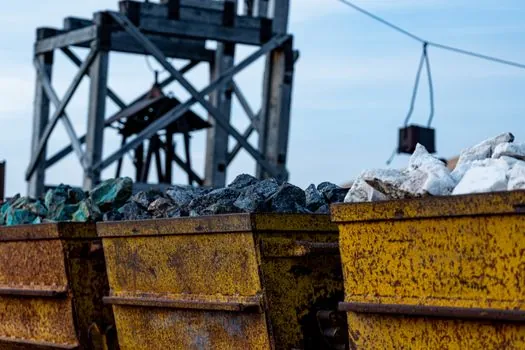
Codelco, the world's largest copper producer, carries approximately $24 billion in debt while managing stagnant output, with 2023 production reaching only 72% of 2004 levels despite higher copper prices [S3]. Chilean supply has been disrupted in 2026 by water shortages, declining ore grades, and labor disputes, removing tonnage precisely when the demand curve inflects [S3]. A 30% global supply deficit forecast means new mine capital must clear a 7-10 year permitting and construction cycle to materially close the gap [S2].
Recycling alone will not bridge the shortfall. Even with aggressive scrap recovery, secondary supply typically caps below 35% of refined output in mature markets, leaving primary mining responsible for the marginal tonne [S2]. The IEA's 10 Mt/year shortfall figure for 2040 assumes energy-transition demand rises on its central scenario, not an upside case, which is why Wood Mackenzie, JP Morgan, and Goldman frame the 2026-2030 window as structurally tight rather than cyclically so [S2].
Industrial Implications: Spec Gates for Engineers and Buyers
For specifiers in flow meter, pressure transmitter, and motor-winding applications, the operative risk is not headline LME price but cathode grade availability, with Cu-ETP (CW004A / ASTM C11000) supply tightening first because the same refineries feed conductor, brass, and bronze alloys. Procurement teams should lock in 12-18 month cathode contracts now and qualify secondary sources, since spot markets through 2026 have already shown $1,000-2,000/mt intraday swings [S3].
Designers can also substitute where the application allows: aluminum for large busbars and overhead lines, optical fiber for short data links, and aluminum windings in distribution transformers where footprint is not critical. Each substitution has its own supply chain, and a parallel view of aluminum 2026 capacity and alloy grades is worth reading alongside any copper substitution decision. For applications where copper is non-negotiable, such as magnet wire in industrial valve actuator coils and PLC I/O backplanes, plan for 5-10% price escalation clauses in 2027 and 2028 contracts, consistent with the structural deficit thesis [S2][S3].
Risks, Counter-Signals, and What Could Break the Call
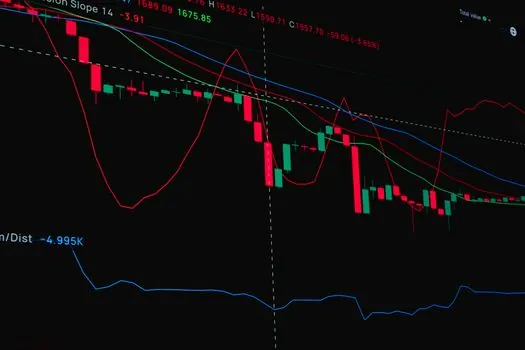
The bear case rests on three legs: a deeper Chinese property slowdown reducing construction-grade copper pull, faster-than-expected scrap recovery, and a recession in EV demand. The World Bank's $9,800/mt 2026 forecast sits at the low end and effectively prices in softer Chinese demand plus some demand destruction [S3]. Conversely, any sustained Strait of Hormuz risk premium, an active US-Iran flash point in early 2026, can add $300-500/mt within weeks, as it did in mid-2025 before fading by early July 2026 [S3].
Mine supply elasticity is asymmetric: bringing 100,000 tonnes of new annual capacity online typically takes 5-7 years from feasibility study, and Codelco's stagnant output trajectory shows that even operational optimisation at mature assets has limited room to grow [S3]. The most trackable forward signal is the LME copper cash-to-three-month spread, which inverted briefly in early 2026, and the COMEX-LME arb, which widened as US tariff rhetoric around copper imports resurfaced in spring 2026. Watch both spreads through Q4 2026 for confirmation of the 330,000 tonne deficit thesis or the first sign of demand destruction [S3][S8].