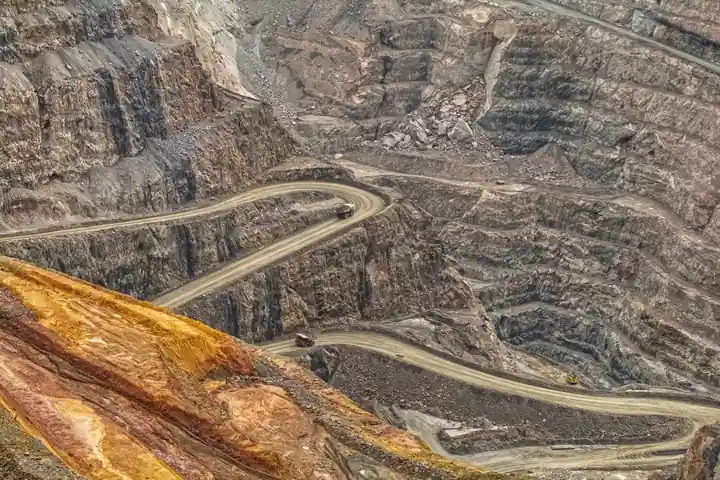
World copper mine capacity expanded roughly 3.8% to 14.70 million tonnes in the first half of 2026, yet actual output fell 1.1% to 11.34 million tonnes as utilization dropped from 81.0% to 77.1%, a gap that implies around 570,000 tonnes of forgone production at the prior operating rate [S3].
Refined copper production growth is set to decelerate to 0.9% in 2026 from 3.4% the prior year, a slowdown driven entirely by limited copper concentrate rather than smelter capacity itself, since China already accounts for over 90% of the past decade's growth in global copper smelting and has lifted its share of global smelting capacity from around 15% to 50% by 2025 [S2][S5].
Why Mine Output Fell Despite Added Capacity
Concentrate output declined 2.6% in H1 2026, outweighing 4.3% growth in solvent extraction-electrowinning (SX-EW), so the production shortfall is structural rather than a function of installed nameplate [S3]. Chilean mine production fell 6.6% as El Teniente, Escondida, and Spence cut concentrate output by 8% and SX-EW by 1%, while Indonesia's concentrate production dropped 32% as the September 2025 mud rush continued to restrict Grasberg [S3].
DRC concentrate output declined 34% following the 2025 Kamoa seismic event, partially offset by an 8% SX-EW gain in the same country, while Peruvian production rose 2% and Mongolia's Oyu Tolgoi concentrate climbed about 20% as it ramped up, with Australia losing roughly 10% on the Mount Isa closure [S3]. Cochilco cut its 2026 Chilean forecast to 5.27 million tonnes, 2.6% below 2025, before projecting 5.55 million tonnes for 2027 on improvements at existing operations rather than new mines [S3].
The Concentrate Bottleneck Refining Cannot Fix
Global mine production is still expected to rise by about 2.3% in 2026, with expansions concentrated in Chile, Peru, Zambia, and an Indonesian rebound, but smelters downstream cannot convert that nameplate into refined metal without concentrate [S2]. The ICSG's 2026 refined copper deficit of 150,000 metric tons, revised from a previously expected surplus of 209,000 tons, captures that bind directly [S2].
J.P. Morgan estimates the 2026 deficit closer to 330,000 tons, and concentrate tightness is projected to cumulate to roughly three million tons by 2036 if the current pipeline holds, with most new supply coming from expansions of existing mines rather than greenfield builds [S2][S4]. Average ore grades have already fallen from 1.02% earlier in the decade, and the 2001-2012 average dropped by nearly 30%, a downward drift that raises rock-handling energy and costs per pound of contained copper [S2].
Demand Vectors Pulling Against the Supply Curve
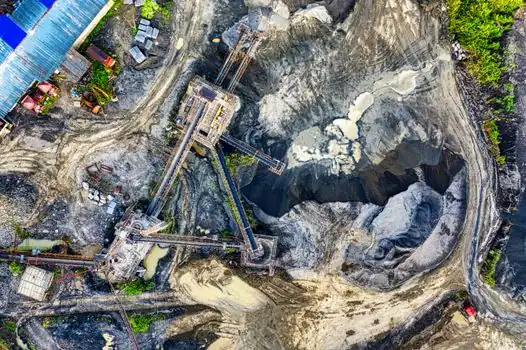
Data center copper demand is forecast to climb from 1.1 million metric tons in 2025 to 2.5 million metric tons by 2040, with a single hyperscale AI facility requiring up to 50,000 tons of copper and AI infrastructure alone projected to consume 500,000 metric tons annually by 2030 [S4]. Battery-electric vehicles use about 83 kg of copper versus 23 kg for a conventional gas car, an intensity factor of roughly 3.6x that is set to push EV-related copper demand to 4.3 million metric tons annually by 2035 [S2][S4].
Offshore wind needs an estimated 8,000 kg of copper per MW, grid expansion to 2050 net-zero targets is projected to require 152 million km of new line and roughly 427 million metric tons of copper, and a full renewable transition by 2050 would require a 460% production increase, equivalent to 194 additional major mines beyond the current pipeline [S2][S4]. Codelco, the world's largest producer, stagnated at 1.332 million tons in 2025, a marginal 0.3% year-on-year increase following deep-level mining accidents, and is targeting only a 10,000-ton lift in 2026 [S4].
Smelter-Side Reality: Capacity Is Not the Constraint
China accounted for over 90% of the growth in global copper smelting between 2015 and 2025, lifting its share of global capacity from around 15% to 50%, so the bottleneck has migrated decisively upstream into concentrate supply, not into furnace or electrolytic nameplate [S5]. LME cash copper hit an all-time high of USD 13,300 per metric ton on 6 January 2026, briefly exceeding USD 14,500 per tonne intraday that same month, a 50% year-on-year move that price action itself signals concentrate scarcity rather than smelter shortage [S1][S4].
Goldman Sachs projects the LME copper price will remain between USD 10,000 and USD 11,000 per ton through 2026 with a long-term target of USD 15,000 per ton by 2035, while the London Metal Exchange itself predicts a 2026 average near USD 12,100 per ton, reflecting the same underlying tightness [S2]. Global inventories exceeded 1.3 million tons in March 2026, a stock overhang that has so far failed to soften spot pricing, suggesting the buffer is concentrated in forms that smelters cannot readily consume [S2].
Decision Matrix: Where the Gap Hurts Most
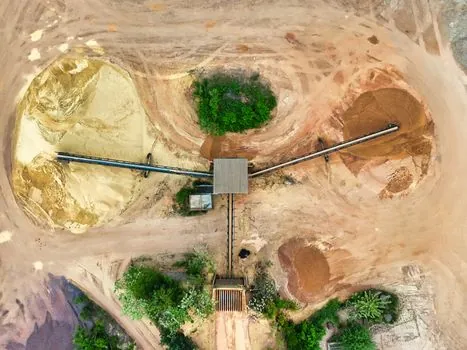
Project ramp-ups alone, even at current development-stage assets with completed feasibility studies and environmental approvals, cannot replace the lost concentrate before the 2030s, since exploration-stage discoveries require years of drilling, studies, permitting, and financing [S3]. A battery-electric passenger vehicle at 83 kg of Cu, a hyperscale AI campus at up to 50,000 tonnes, and a 1 MW offshore wind turbine at roughly 8,000 kg all sit downstream of the same constrained concentrate pool, so end-use choice does not relieve upstream pressure [S2][S4].
The global copper mining market was valued at USD 9.61 billion in 2025, is projected at USD 9.94 billion in 2026, and is expected to reach USD 14.34 billion by 2034, while the broader copper market is valued at USD 195 billion in 2025 and projected to reach USD 229.8 billion by 2033 at a 2.3% CAGR [S2][S6]. The relevant per-tonne decision metric for smelter operators is not installed furnace capacity, which China has already absorbed, but toll terms and concentrate availability: a 1.1% H1 2026 output decline against 3.8% capacity expansion, 81.0% prior-year utilization versus 77.1% in H1 2026, and a 570,000-tonne implied production shortfall at the previous rate [S3].
Trackable Signals for H2 2026 and Beyond
If second-half ICSG data show mine capacity utilization recovering toward 81.0%, the H1 decline reads as a temporary operating shock, but if utilization stays near 77.1%, it supports a longer replacement-supply gap through 2030 [S3]. Grasberg and Kamoa recovery timelines are the single most consequential variables, since both losses trace to operating incidents rather than ore-body depletion, with Indonesia's 32% concentrate drop and DRC's 34% concentrate drop still running at full force through mid-2026 [S3].
The IEA's projected 2035 copper supply deficit has narrowed from around 30% in the prior Outlook to 25% as new projects advance, particularly in the DRC and Zambia, and a separate demand-side reading for grid, EV, construction, and electronics flows through 2026 is laid out in this copper demand breakdown [S5]. For process engineers sizing electrolytic cells, tankhouse rectifiers, or flow meter upgrades, the binding input is concentrate availability rather than smelter nameplate, and the next ICSG quarterly release is the highest-signal checkpoint before any 2027 capex commitment.
The underlying component specifications are covered under copper material, and pressure transmitter.