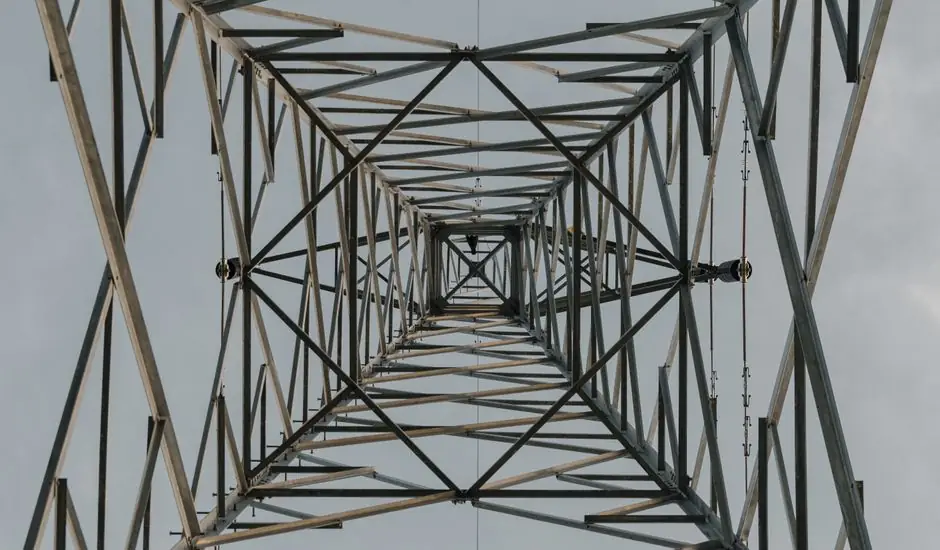
Electrification is the dominant structural force lifting copper consumption in 2026, with grid buildout, EV production, and data-center power infrastructure acting in parallel rather than in sequence [S1]. In September 2026, LME three-month copper traded near $14,700 per metric tonne, a fresh high that reflects a tightening physical balance rather than a one-off speculative move [S5].
Market reports through 2026 have identified AI, data centers, electricity grids, and EVs as the structural demand drivers supporting prices, with construction and electronics adding a more cyclical overlay [S2][S5]. J.P. Morgan's 2026 estimate puts data-center new-installation copper demand alone at around 475,000 tonnes for the year, a figure that would have been negligible a decade earlier [S6].
Grid and Power Infrastructure: The Largest Hidden Block
Transmission lines, distribution networks, and power cables are among the fastest-growing copper demand segments, because grid expansion, modernization, and interconnection are needed to absorb renewable generation, EV charging, and rising baseline load [S1]. Renewable power infrastructure can require several times more copper per unit of generation than fossil-fuel plants of equivalent nameplate capacity, which compounds the per-megawatt intensity [S1].
For procurement teams, the practical implication is that grid copper demand is now embedded in multi-year utility capex cycles, not spot purchases, which is one reason supply responses look slow. copper material specifications for conductor grades, such as C11000 electrolytic tough pitch for busbars and AAC/AAAC/ACSR for overhead lines, are being drawn into long-dated utility frameworks rather than short tenders. The wider supply-demand modeling from ScienceDirect indicates that, on a Net-Zero-by-2050 trajectory, mined copper would need to reach 91.7 Mt per year by 2050, roughly 2.5 times the rate implied by business-as-usual demand, which frames how steep the upstream curve is [S3].
Electric Vehicles: Traction Motors, Busbars, and Charging
EVs typically require substantially more copper than internal-combustion counterparts across traction motors, battery connections, busbars, wiring harnesses, charging systems, power electronics, connectors, and thermal-management circuits [S5]. Reference vehicle copper content used in the ScienceDirect scenarios is 24 kg per internal-combustion vehicle and 29 kg per hybrid, with plug-in hybrid figures close to that range [S3].
Charging infrastructure adds a second layer: DC fast-charging stations, depot chargers, and the upstream distribution feeders that feed them are all copper-dense. The Sprott analysis places clean-energy copper demand on a path to reach 61% of total copper demand by 2040 on the global energy transition trajectory, with EVs and grid hardware carrying most of the increment [S4]. For buyers of construction machinery and equipment feeding into charging-site civil works, this means copper-exposed electrical content is increasingly embedded in site-level BOMs alongside steel and concrete.
Construction and Buildings: Cyclical, but Still a Base-Load Sink

Construction remains one of the three traditional pillars of copper demand alongside power generation and electronics, and it tends to track interest-rate-sensitive residential and commercial build cycles more than it tracks electrification [S2]. The ScienceDirect baseline notes a striking per-capita gap: the United States built environment holds about 200 kg of copper per capita, while India's built environment holds roughly 0.5 kg per capita, a 400x differential that frames how much "catch-up" demand sits in developing-economy urbanization [S3].
In mature markets, the more interesting signal is retrofits and electrification overlays: heat-pump conversions, building-management rewires, and rooftop-solar interconnects all pull copper into existing stock. Wiring accessories, distribution boards, and lamps and light fittings all carry copper content that is small per unit but massive in aggregate, especially when LED retrofit programs are run at city scale.
Electronics and Data Centers: The New 2026 Layer
Electronics manufacturing, including semiconductors, printed circuit boards, connectors, and data-center power and cooling hardware, is identified by Fortune Business Insights as one of the three primary demand pillars alongside construction and power generation [S2]. The 2026-specific addition is AI compute: data centers need extensive electrical infrastructure to feed power-hungry GPU racks, and that infrastructure is copper-intensive from the grid tap through to the busbar inside the white space.
J.P. Morgan's 2026 estimate of approximately 475,000 tonnes of copper for new data-center installations captures only the new-build slice, not the ongoing retrofit and expansion pipeline [S6]. The Zetwerk supply-side read-through is that volatile copper prices directly hit BOM cost on this equipment: a 10 kg copper component moving from Rs 800/kg to Rs 1,200/kg adds Rs 4,000 of material cost, and that math scales linearly with the copper content in lighting equipment and electric lamps, switchgear, and PDUs feeding the same sites [S5].
Supply-Side Reality Check: Mines Cannot React Quickly
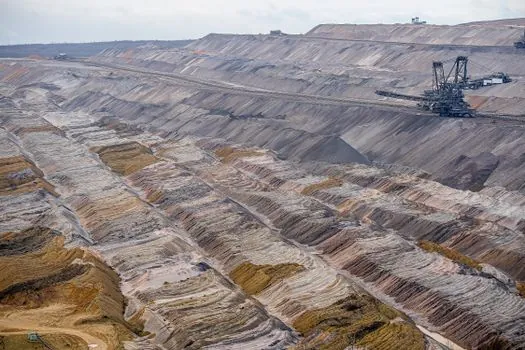
New copper mines take years to develop, and existing operations face declining ore grades, operational disruptions, and geopolitical risk; global mine output declined during the first half of 2026, which is part of why the physical balance has tightened [S5]. Historical mine production rose from 0.5 Mt per year in 1900 to 20.4 Mt per year in 2018, and the ScienceDirect baseline projection puts mined copper demand at 37.1 Mt per year by 2050 even without aggressive electrification [S3].
Add full electrification after 2035 and the cumulative 2018-2050 mining requirement rises by 13% to 1,248 Mt, requiring a 2050 mining rate of 45.7 Mt per year; add Net-Zero-by-2050 and the cumulative requirement roughly doubles to 2,304 Mt, with a 2050 rate of 91.7 Mt per year [S3]. The electrification scenario assumes 24 kg Cu per ICE vehicle and 29 kg per hybrid, and uses those values as the per-vehicle anchor across all modeling, which is conservative for newer BEV architectures that trend higher [S3].
Comparison of the Four Demand Sectors
The four sectors differ sharply on growth rate, copper intensity per unit, and contract structure, which matters for how exposed any given manufacturer or utility buyer is. Grid is capex-locked and long-dated; EV is scaling fastest on a percentage basis but starts from a smaller base; construction is large but cyclical; electronics and data centers are the new 2026 wildcard with very high intensity per rack [S1][S2][S5][S6].
The comparison shows that two sectors (grid, EVs) are structurally locked in by capex commitments, while the other two (construction, electronics) are more cyclical but deliver the volume. For a manufacturer or EPC contractor, the practical exposure map is: copper-heavy BOMs sold into grid and EV channels carry the most price risk, while construction and electronics channels carry the most volume risk.
What Specifiers and Buyers Should Track
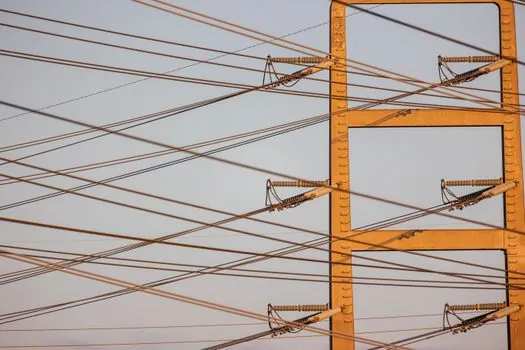
Track three signals: the LME three-month quote and the MCX Indian quote, which moved to roughly Rs 1,379/kg on 11 September 2026, as the cleanest spot read on physical tightness [S5]. Track the pressure transmitter and cable order books feeding utility substations, since those are the earliest leading indicators of grid capex being released.
Track quarterly mine-output prints and cathode-equivalent inventories, because the supply side is the binding constraint and cannot ramp inside a single year [S3][S5]. The Data-center sub-segment is worth watching in isolation: the 475,000 t J.P. Morgan figure for 2026 is a single-year snapshot, and the 2027 number will reveal whether hyperscalers are still in build-mode or starting to optimize cable and busbar content per MW [S6].
Background reading: Precious-Metal Sputtering Target Pricing: Drivers, Grades, and Reclaim Economics.