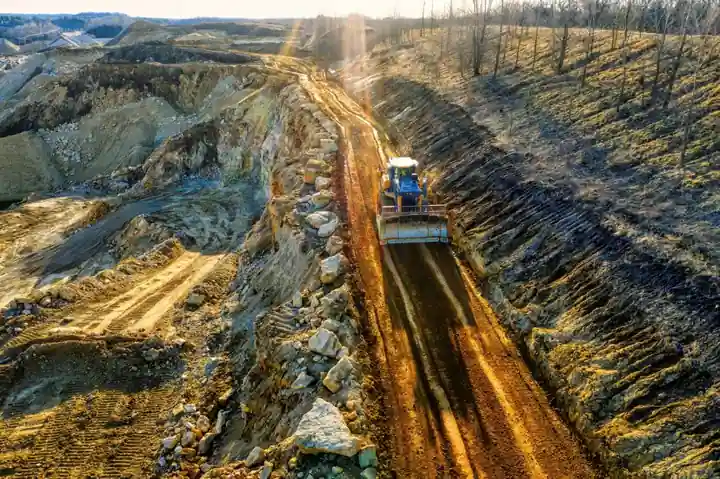
Global average copper ore grades have fallen roughly 40% since 1991, and a separate global mine sample shows about a 25% drop in just ten years, with Chilean operations recording a 28.8% grade decline over a similar window [S3][S4][S6].
Energy consumption at those Chilean mines rose 46% between 2003 and 2013 while copper output grew only 30%, a textbook example of how lower head grades force disproportionate inputs to keep cathode production flat [S4]. For buyers and specifiers, the consequence is that incremental concentrate output now demands more tonnes moved, more diesel, more electricity, and more water per pound of metal, even before geopolitical and permitting drag enter the picture [S2].
What "ore grade" means and where the baseline sits
Ore grade is the mass fraction of copper contained in the run-of-mine rock, and the global average for currently mined copper is about 0.62% Cu against roughly 16 Mt Cu/yr of mine production [S1]. Reported global copper mineral resources (about 1,780.9 Mt Cu in the dataset cited) average closer to 0.49% Cu, meaning the active mining fleet is now drawing above the resource base average and that further declines will be slower, but still negative, than the historical 25-40% drop [S1]. Individual century-old assets illustrate the pattern: Bingham Canyon (USA), El Teniente (Chile), and Mt Lyell (Australia) all show a long, monotonic grade decline, with each successive tonne harder to win than the last [S1].
Why falling grades cap output: the material-intensity math
Declining ore grade directly raises material intensity, since a fixed tonnage of contained copper requires moving more waste and processing more ore [S2]. In the Chilean sample, the 28.8% head-grade drop paired with a 30% production rise, so the mine processed substantially more rock to deliver that incremental cathode, and the 46% energy jump is the bill for that extra rock moving, grinding, and flotation work [S4]. Globally, energy consumption per tonne of ore rises as grade falls, and underground operations are consistently more energy-intensive than open cut, which sets a hard floor on how cheaply any new project can add tonnage [S4]. The supply-side consequence is blunt: even if a mine doubles ore throughput, net contained-copper output can stay flat or grow only marginally when head grade is collapsing, which is why industry tracking now shows 17-year average mine development timelines and only 14 new copper deposits in active development pipelines [S6].
Side-by-side: high-grade, mid-grade, and low-grade operating regimes

A useful comparison is across the three operating regimes the data implies. Mature high-grade districts (Bingham Canyon, El Teniente, Chuquicamata) start above 1% Cu, but their century-long grade drift means most have settled into the 0.5-0.8% Cu range and continue declining, with energy per tonne of contained copper trending upward each decade [S1][S5]. Across all three regimes, common failure modes are tight water availability, energy interruptions, and labour disruptions, each of which hits low-grade, high-throughput sites hardest because their operating margin per tonne of ore is thinner [S2].
Selection logic for downstream specifiers and planners
For procurement, smelter scheduling, and grid infrastructure planning, the practical selection question is no longer "what is the LME copper price," but "what cathode volume is physically deliverable given the grade trajectory." A buyer locking into long-term offtake should stress-test supplier disclosures for head grade, strip ratio, and energy intensity, since the 25-40% historical grade decline means a mine's stated reserves today are typically processed at materially worse economics than those same tonnes would have shown a decade ago [S1][S3]. Concentrate purchasers should also track treatment and refining charges, which have already moved to reflect tight downstream capacity and rising impurity loads from lower-grade, more refractory ore [S2]. Planners sizing electrification projects should expect 17-year lead times from discovery to first cathode, which puts any 2030-2035 demand uplift firmly into the "must be already in construction today" bucket [S6].
Limits, exceptions, and where the decline rate can flatten
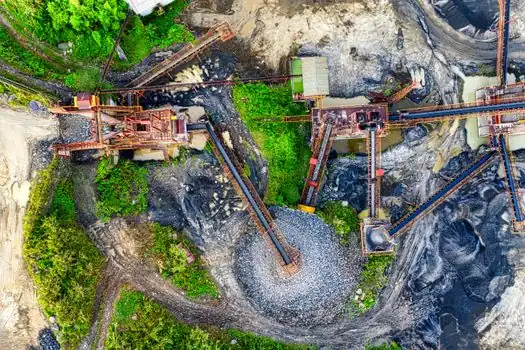
Two important caveats keep the picture from being a straight line down. First, mine-site ore grade is the product of cut-off grade economics, not just geology, so a sustained higher copper price does expand the economic ore pool and can slow or partially reverse the head-grade decline at a given site [S1][S5]. Second, innovation in extractive metallurgy, heap leaching, and electrified mining fleets can lift recovery rates enough to offset part of the grade drop, which is why some studies argue the resource base is more elastic than the simple "running out" framing suggests [S3]. On the other side, the cited 40% grade fall since 1991 and the 25% global drop in ten years are not forecasts, they are measured trends across the operating mine fleet, and they sit on top of an environmental permitting regime that has lengthened project lead times well beyond what the geology alone would require [S2][S6]. Net effect: the most reliable planning assumption is that ore grade will keep drifting lower, that energy and water per tonne of cathode will keep drifting higher, and that 17-year development lead times will keep new metal from arriving fast enough to balance the demand side of the equation.
The next trackable node is the 2026 full-year reporting on the 14 active copper deposits in the global pipeline, particularly any disclosure of head grade, strip ratio, and first-cathode date, which will test whether the 17-year timeline is shortening or lengthening. A second signal is the Chilean Cochilco annual energy and water intensity per tonne of fine copper, which is the cleanest public proxy for whether the 28.8%-in-ten-years grade decline is accelerating or stabilising as deeper, lower-grade ore replaces the open-pit reserves [S4].
The underlying component specifications are covered under copper material, checking and testing apparatus, and construction machinery and equipment.